

HOT TOPICS LIST
- MACD
- Fibonacci
- RSI
- Gann
- ADXR
- Stochastics
- Volume
- Triangles
- Futures
- Cycles
- Volatility
- ZIGZAG
- MESA
- Retracement
- Aroon
INDICATORS LIST
LIST OF TOPICS
PRINT THIS ARTICLE
by Matt Blackman
Amazon has seen better days, but is its reputation as a market leader behind it forever, or on temporary hiatus?
Position: N/A
Matt Blackman
Matt Blackman is a full-time technical and financial writer and trader. He produces corporate and financial newsletters, and assists clients in getting published in the mainstream media. Matt has earned the Chartered Market Technician (CMT) designation. Follow Matt on Twitter at www.twitter.com/RatioTrade
PRINT THIS ARTICLE
TREND-CHANNEL
Amazon Under Pressure
06/13/19 02:27:49 PMby Matt Blackman
Amazon has seen better days, but is its reputation as a market leader behind it forever, or on temporary hiatus?
Position: N/A
| It has been a volatile year for stocks, and especially FAANG market leader and tech darling Amazon. Since peaking at 2050 in early September 2018, the stock has retreated more than 14% and headwinds continue to buffet it. As we see from the first chart (Figure 1), AMZN dropped below major support at 1760, slicing through its 20-day moving average in the process in early June. Not only have stock traders been selling, options traders have also become increasingly bearish on the stock since early May. |
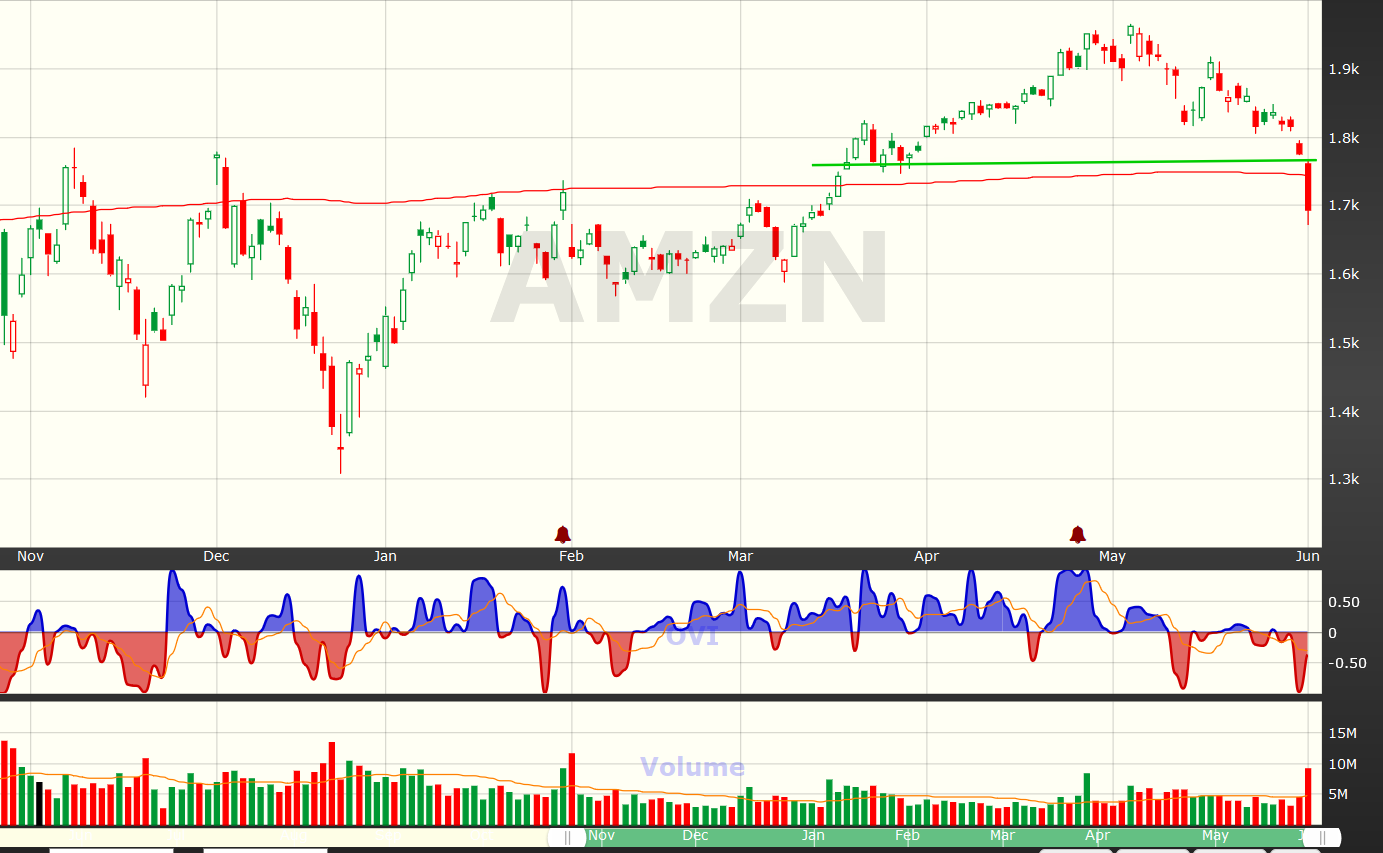
|
| Figure 1. Daily chart of Amazon (AMZN) showing the break of support at 1760 and breach of the 20 day moving average on June 3. The break occurred on a negative OVI index reading (lower subgraph) which reveals bearish options activity. |
| Graphic provided by: www.ovitraders.com/. |
| |
| In the next weekly chart (Figure 2), we see the medium-term picture showing what looks like a double top chart pattern in the process of forming with a neckline of 1350 — nearly 30% below where the stock was trading. |
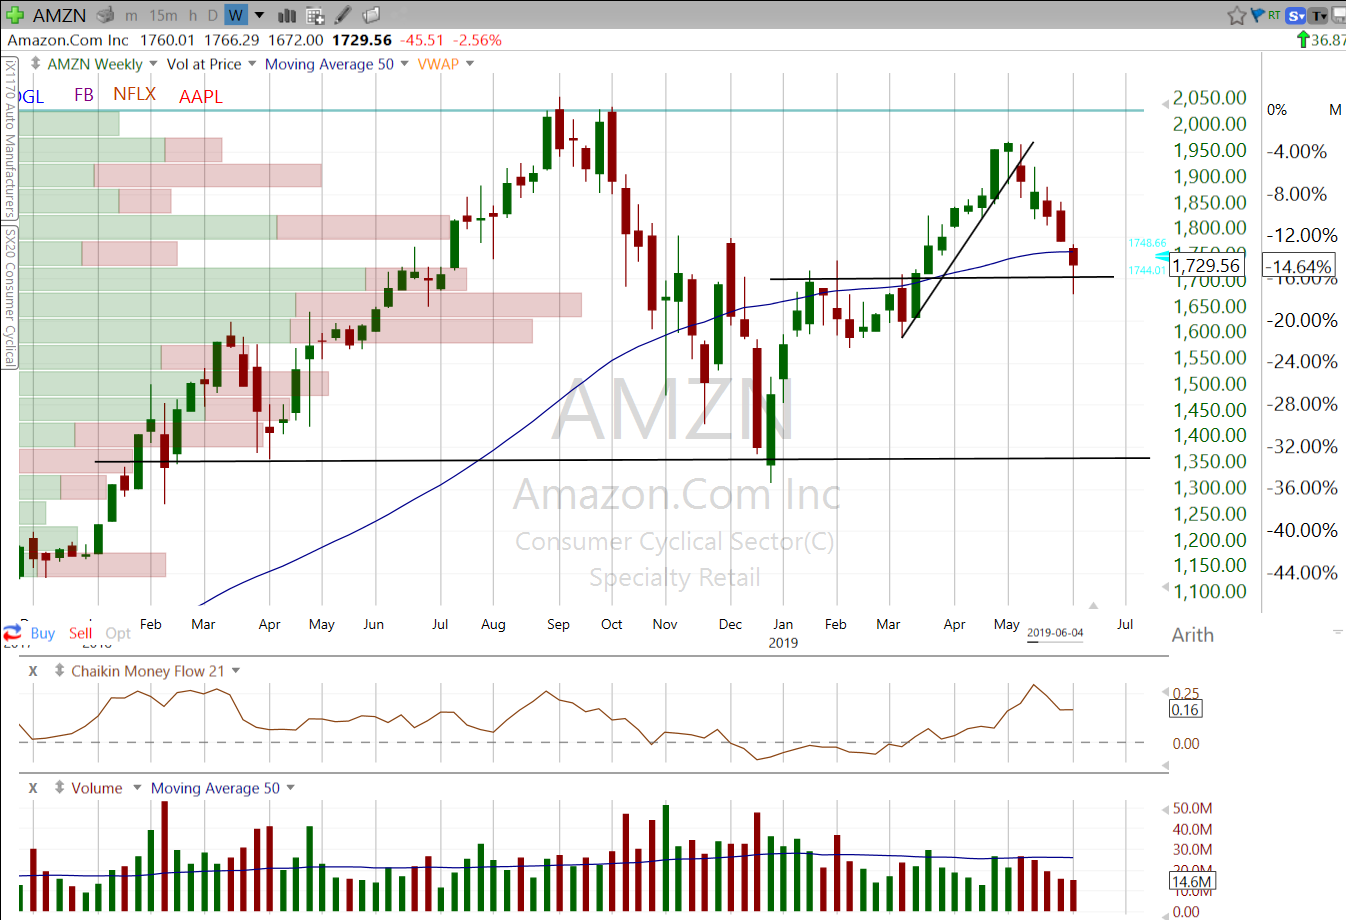
|
| Figure 2. Weekly chart of Amazon showing 2018 high and second peak in May. |
| Graphic provided by: Freestockcharts.com. |
| |
| And as we see from the third chart (Figure 3) showing the bigger picture, AMZN is trading more than 22% above its long-term uptrend support line, which is the next major support for the stock. A break below this line would spell the end of an uptrend that has been in place since 2015. |
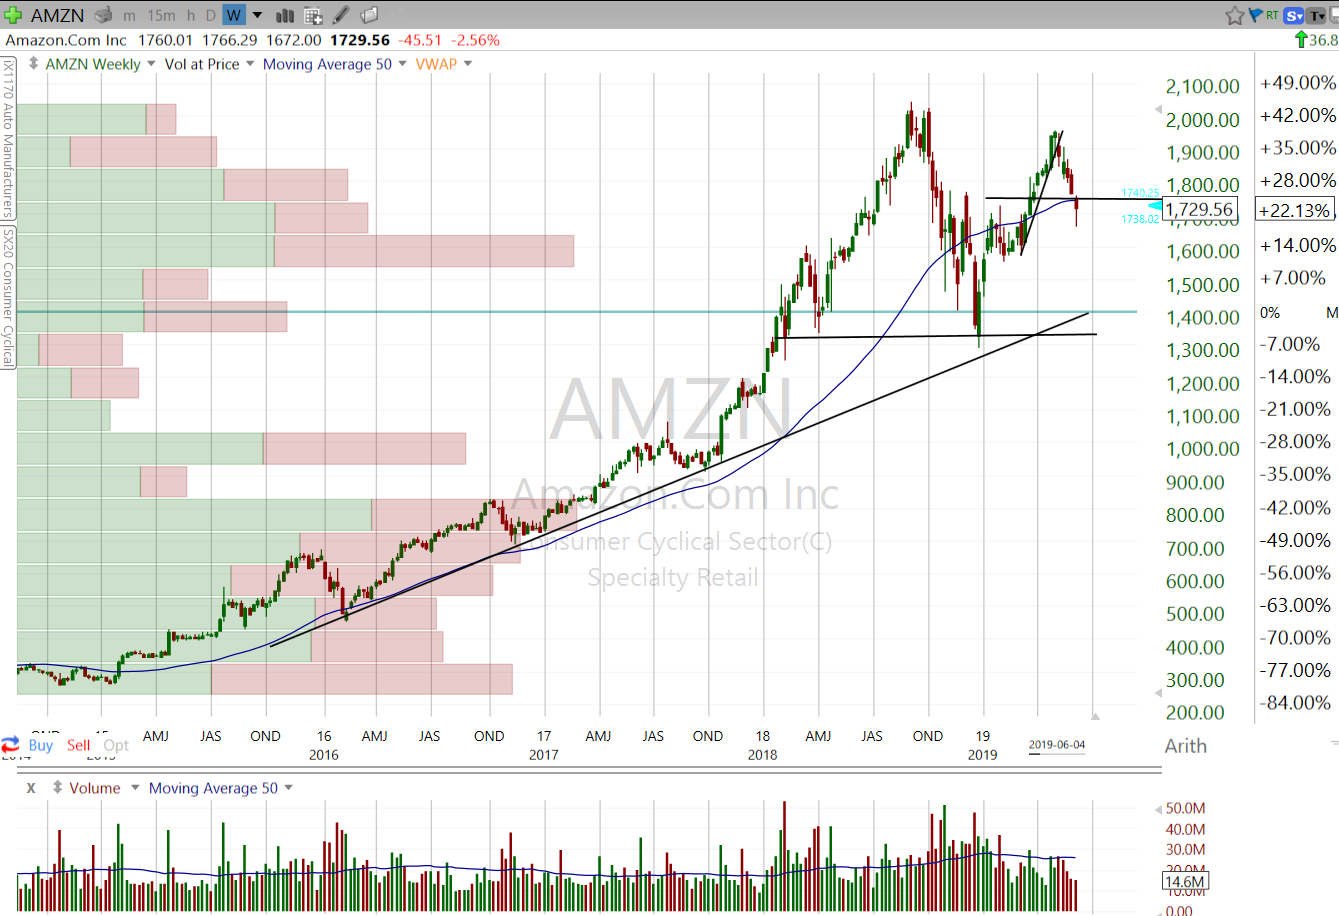
|
| Figure 3. Weekly chart showing the big picture for AMZN with long-term uptrend support around 1400. |
| Graphic provided by: Freestockcharts.com. |
| |
| Fundamentally, the stock is still expensive with a trailing price/earnings ratio of 72.5. But as of the latest earnings report on April 25, earnings were up more than 117% in the latest quarter and more than 200% in the last year, both of which are bullish. To borrow a phrase from writer Mark Twain upon reading of his death in the newspaper, rumors of Amazon's demise are greatly exaggerated. Yes, the technical signs are pointing to further downside action but it will take more technical and fundamental evidence before a long term bearish bet on the stock would be justified. |
Matt Blackman is a full-time technical and financial writer and trader. He produces corporate and financial newsletters, and assists clients in getting published in the mainstream media. Matt has earned the Chartered Market Technician (CMT) designation. Follow Matt on Twitter at www.twitter.com/RatioTrade
| Title: | Author |
| Company: | TradeSystemGuru |
| Address: | Box 2589 |
| Garibaldi Highlands, BC V0N1T0 | |
| Phone # for sales: | 6048989069 |
| E-mail address: | indextradermb@gmail.com |
Traders' Resource Links | |
| TradeSystemGuru has not added any product or service information to TRADERS' RESOURCE. | |
Click here for more information about our publications!
PRINT THIS ARTICLE

Request Information From Our Sponsors
- StockCharts.com, Inc.
- Candle Patterns
- Candlestick Charting Explained
- Intermarket Technical Analysis
- John Murphy on Chart Analysis
- John Murphy's Chart Pattern Recognition
- John Murphy's Market Message
- MurphyExplainsMarketAnalysis-Intermarket Analysis
- MurphyExplainsMarketAnalysis-Visual Analysis
- StockCharts.com
- Technical Analysis of the Financial Markets
- The Visual Investor
- VectorVest, Inc.
- Executive Premier Workshop
- One-Day Options Course
- OptionsPro
- Retirement Income Workshop
- Sure-Fire Trading Systems (VectorVest, Inc.)
- Trading as a Business Workshop
- VectorVest 7 EOD
- VectorVest 7 RealTime/IntraDay
- VectorVest AutoTester
- VectorVest Educational Services
- VectorVest OnLine
- VectorVest Options Analyzer
- VectorVest ProGraphics v6.0
- VectorVest ProTrader 7
- VectorVest RealTime Derby Tool
- VectorVest Simulator
- VectorVest Variator
- VectorVest Watchdog