HOT TOPICS LIST
- MACD
- Fibonacci
- RSI
- Gann
- ADXR
- Stochastics
- Volume
- Triangles
- Futures
- Cycles
- Volatility
- ZIGZAG
- MESA
- Retracement
- Aroon
INDICATORS LIST
LIST OF TOPICS
PRINT THIS ARTICLE
by Matt Blackman
Before entering a trade, it pays to measure one indicator that says much about a market.
Position: N/A
Matt Blackman
Matt Blackman is a full-time technical and financial writer and trader. He produces corporate and financial newsletters, and assists clients in getting published in the mainstream media. Matt has earned the Chartered Market Technician (CMT) designation. Follow Matt on Twitter at www.twitter.com/RatioTrade
PRINT THIS ARTICLE
MOMENTUM
Measuring The Strength Of A Rally
06/06/19 03:49:45 PMby Matt Blackman
Before entering a trade, it pays to measure one indicator that says much about a market.
Position: N/A
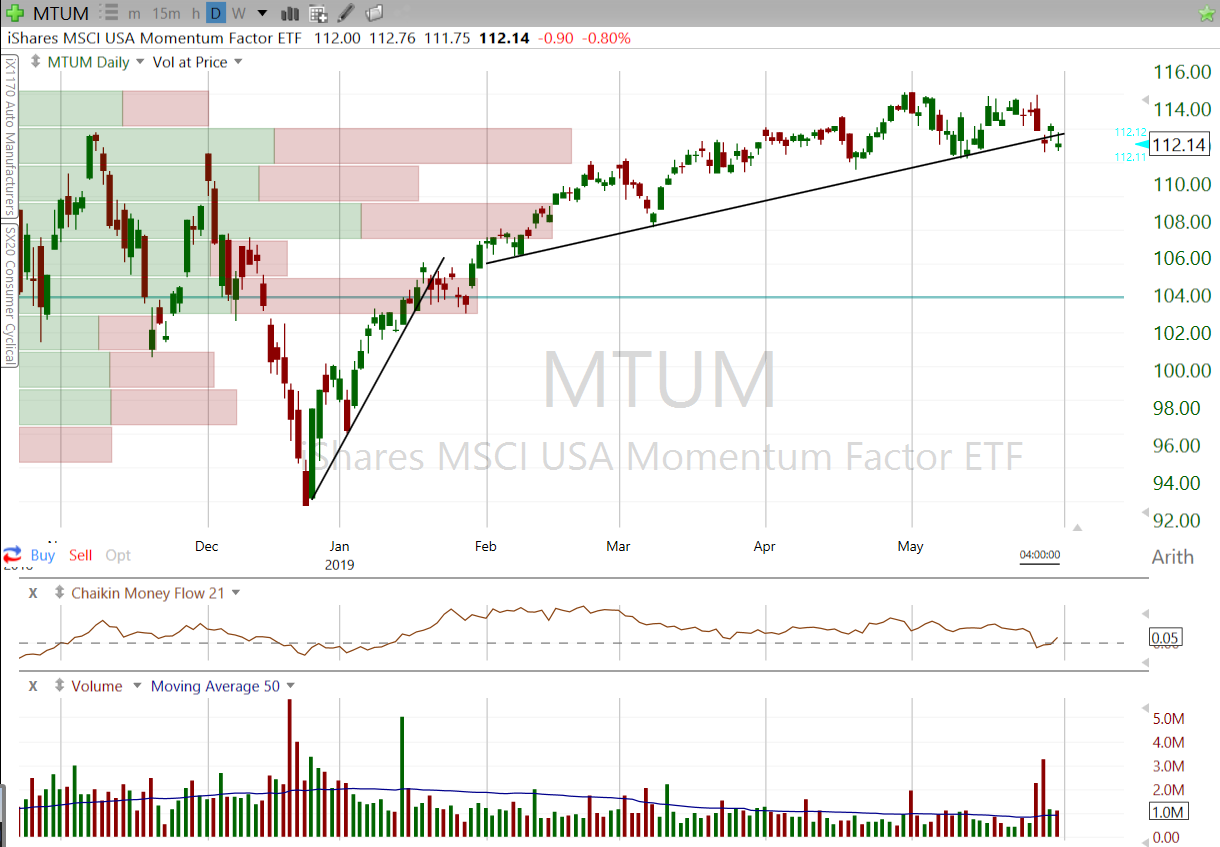
| Trading is at least as much about maintaining an accurate bird's eye view as it is about finding stock candidates. And all too often, traders get lost in their hunt to find the best trading trees while losing sight of market forest. And one essential trading tool to measure market health is momentum. Momentum, as discussed in physics texts, measures the force and speed of an object as it gains (or loses) kinetic energy. In a stock, momentum is simply a measure of how quickly price is moving. However, the devil of measuring it in a market is how to gain an accurate overall picture. Luckily, there is an exchange traded fund that does exactly that called the iShares Edge MSCI USA Momentum Factor ETF (MTUM). It uses a basket of stocks "to track the performance of an index that measures the performance of U.S. large- and mid-capitalization stocks exhibiting relatively," according to the iShares.com website. |

|
| Figure 1. Daily chart for MTUM. |
| Graphic provided by: Freestockcharts.com. |
| |
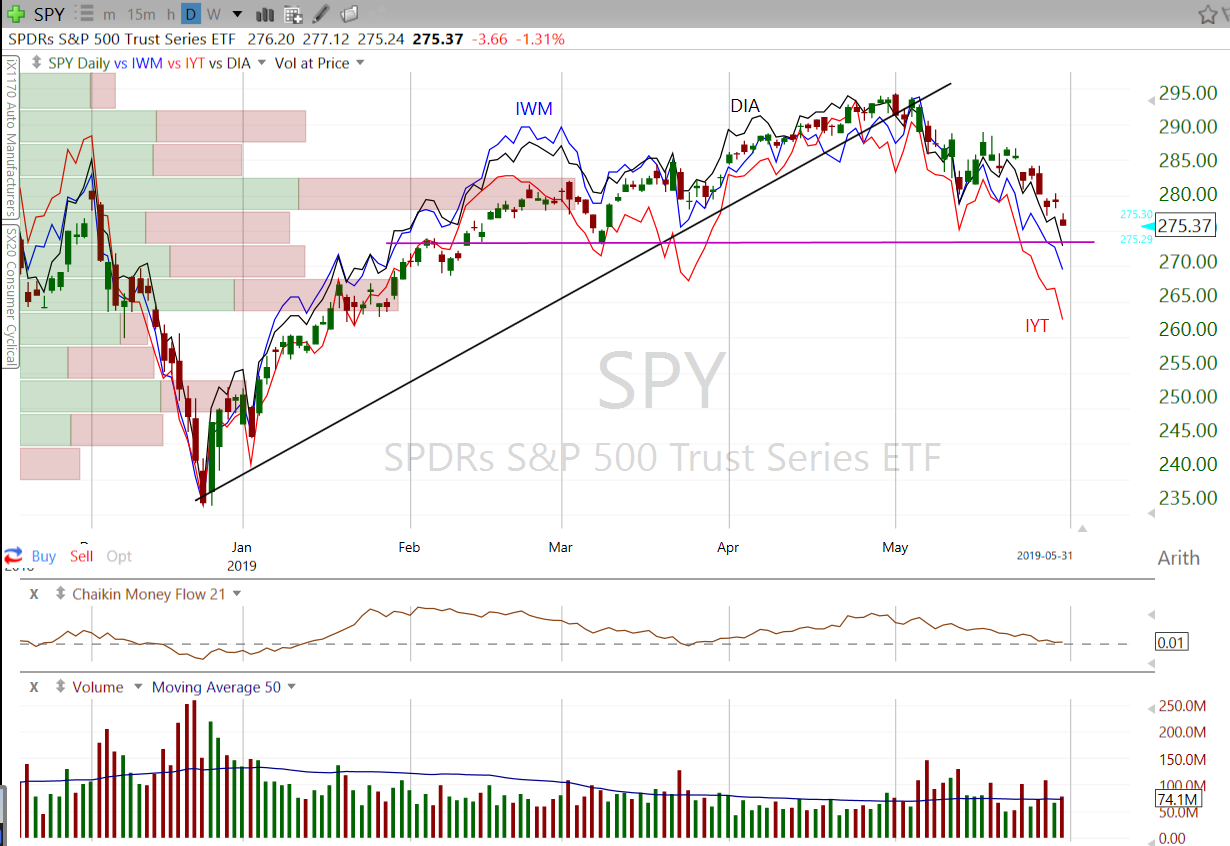
| As we see from the first chart, MTUM bottomed in late December 2018, put in a V-bottom and has been in an uptrend ever since. But as the chart shows, this trajectory flattened in May and the latest uptrend support line was challenged showing a serious leak. As an interesting aside, interest rate followers will remember that the Treasure yield curve first inverted in early December as five-year Treasury yields dropped below three-year rate (see What an Inverted Yield Curve Means for the Stock Market) two weeks before the latest MTUM rally began. Although the MTUM chart still looks positive compared to the major indices, the fact that the Russell 2000, Dow Jones Industrial and Dow Transport ETFs IWM, DIA and IYT have posted bearish topping patterns after breaking their uptrend support lines in early May is a concern (see Figure 2 of SPY, IWM, DIA and IYT). |

|
| Figure 2. SPY vs. IWM vs. DIA vs. IYT. |
| Graphic provided by: Freestockcharts.com. |
| |
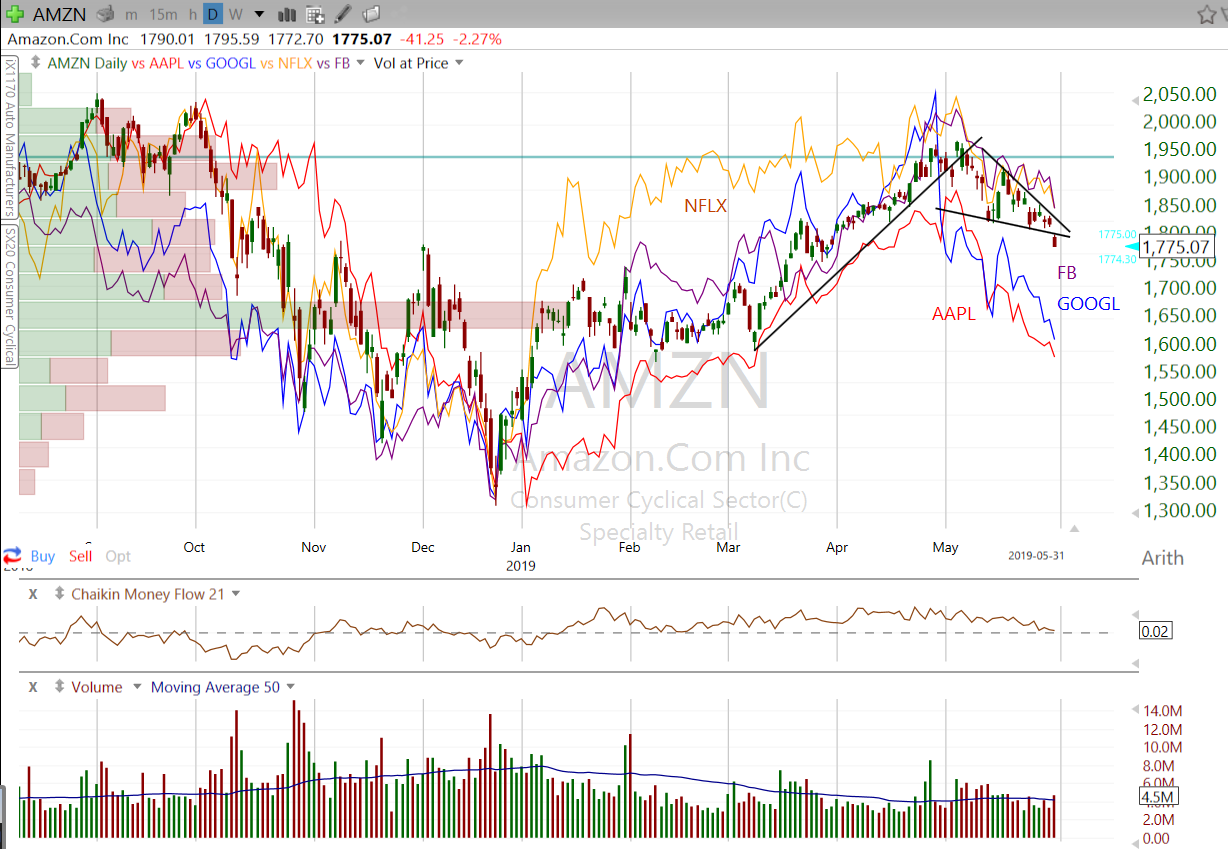
| A similar observation holds true for traders following market leading FAANG stocks (Facebook, Amazon, Apple and Google) as these momentum juggernauts have increasingly struggled since they stocks put in second tops in early May (see Figure 3). |

|
| Figure 3. Daily chart comparing FAANG stocks. |
| Graphic provided by: Freestockcharts.com. |
| |
| As opined in "Gathering Signs of Trouble," bearish chart patterns don't necessarily guarantee that a bear market and/or recession is imminent, but ignoring such signs could be a costly oversight if these technical warnings are proven to be prescient in retrospect. |
| Suggested Reading: Gather Signs of Trouble, Blackman, Matt iShares Edge MSCI USA Momentum Factor ETF What an Inverted Yield Curve Means for the Stock Market |
Matt Blackman is a full-time technical and financial writer and trader. He produces corporate and financial newsletters, and assists clients in getting published in the mainstream media. Matt has earned the Chartered Market Technician (CMT) designation. Follow Matt on Twitter at www.twitter.com/RatioTrade
| Title: | Author |
| Company: | TradeSystemGuru |
| Address: | Box 2589 |
| Garibaldi Highlands, BC V0N1T0 | |
| Phone # for sales: | 6048989069 |
| E-mail address: | indextradermb@gmail.com |
Traders' Resource Links | |
| TradeSystemGuru has not added any product or service information to TRADERS' RESOURCE. | |
Click here for more information about our publications!
Comments
Date: 06/08/19Rank: 3Comment: Look at the RS line to S P500. It has been rising since mid April

|

Request Information From Our Sponsors
- StockCharts.com, Inc.
- Candle Patterns
- Candlestick Charting Explained
- Intermarket Technical Analysis
- John Murphy on Chart Analysis
- John Murphy's Chart Pattern Recognition
- John Murphy's Market Message
- MurphyExplainsMarketAnalysis-Intermarket Analysis
- MurphyExplainsMarketAnalysis-Visual Analysis
- StockCharts.com
- Technical Analysis of the Financial Markets
- The Visual Investor
- VectorVest, Inc.
- Executive Premier Workshop
- One-Day Options Course
- OptionsPro
- Retirement Income Workshop
- Sure-Fire Trading Systems (VectorVest, Inc.)
- Trading as a Business Workshop
- VectorVest 7 EOD
- VectorVest 7 RealTime/IntraDay
- VectorVest AutoTester
- VectorVest Educational Services
- VectorVest OnLine
- VectorVest Options Analyzer
- VectorVest ProGraphics v6.0
- VectorVest ProTrader 7
- VectorVest RealTime Derby Tool
- VectorVest Simulator
- VectorVest Variator
- VectorVest Watchdog
