HOT TOPICS LIST
- MACD
- Fibonacci
- RSI
- Gann
- ADXR
- Stochastics
- Volume
- Triangles
- Futures
- Cycles
- Volatility
- ZIGZAG
- MESA
- Retracement
- Aroon
INDICATORS LIST
LIST OF TOPICS
PRINT THIS ARTICLE
by Matt Blackman
There have been a number of signs that markets are weakening. Here are some new ones.
Position: N/A
Matt Blackman
Matt Blackman is a full-time technical and financial writer and trader. He produces corporate and financial newsletters, and assists clients in getting published in the mainstream media. Matt has earned the Chartered Market Technician (CMT) designation. Follow Matt on Twitter at www.twitter.com/RatioTrade
PRINT THIS ARTICLE
DOUBLE TOPS
Gathering Signs of Trouble?
05/30/19 04:17:48 PMby Matt Blackman
There have been a number of signs that markets are weakening. Here are some new ones.
Position: N/A
| Amid talk of trade wars, a flattening yield curve and weakening markets, debates about where stocks are headed continue to rage. One big advantage of technical analysis is that the reasons behind stock moves are less important than than the moves themselves. When markets change direction, small stocks tracked by the Russell 2000 Index tend to move ahead of large cap indexes such as the Dow Jones Industrial Average or Standard & Poor's 500 Index. And that index has just posted an interesting pattern. |

|
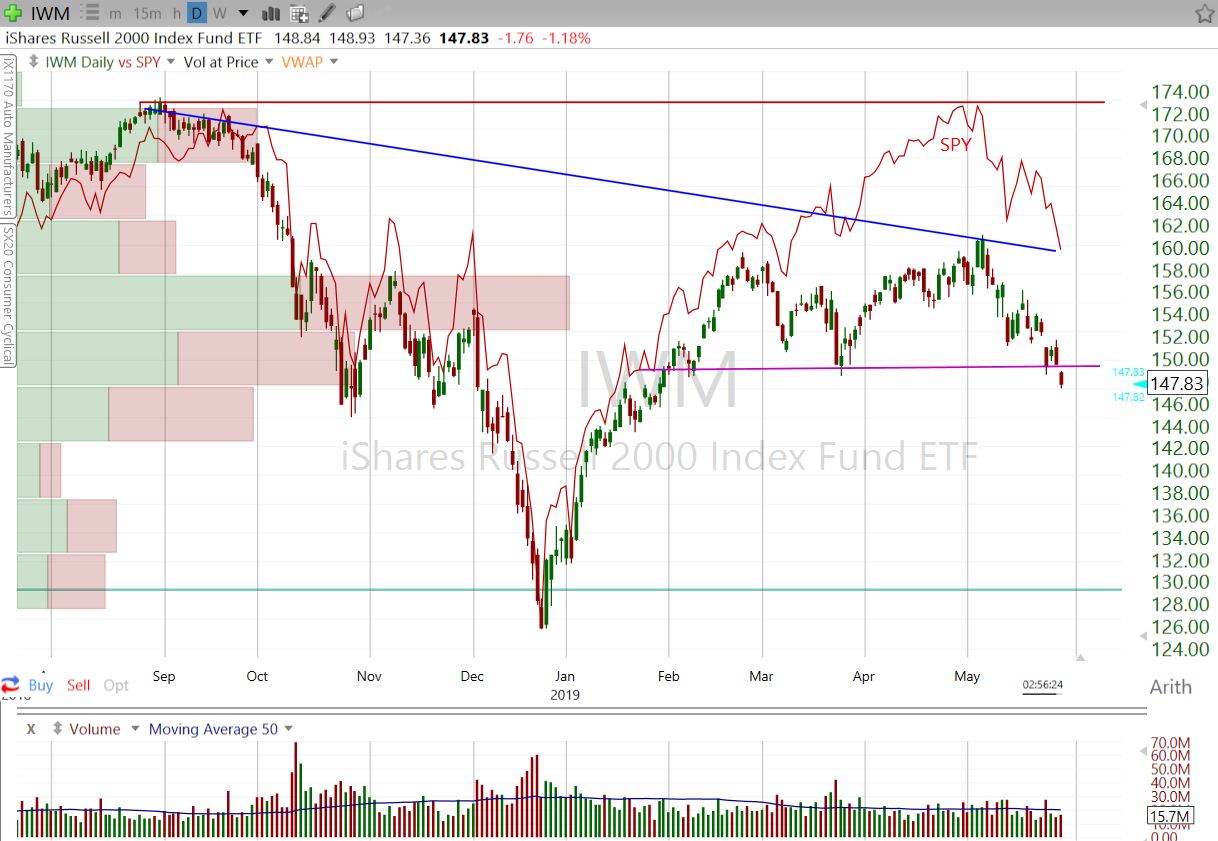
| Figure 1. IWM (iShares Russell 2000 Index ETF) Daily Chart. |
| Graphic provided by: Freestockcharts.com. |
| |
| As we see from Figure 1, IWM posted a bearish Double Top chart pattern. And although the pattern still must survive a retest as the ETF tries to break back above the neckline to be valid, a failure of this retest would have bearish implications for the market given the history of the Russell 2000 to presage blue cap stock moves. |

|
| |
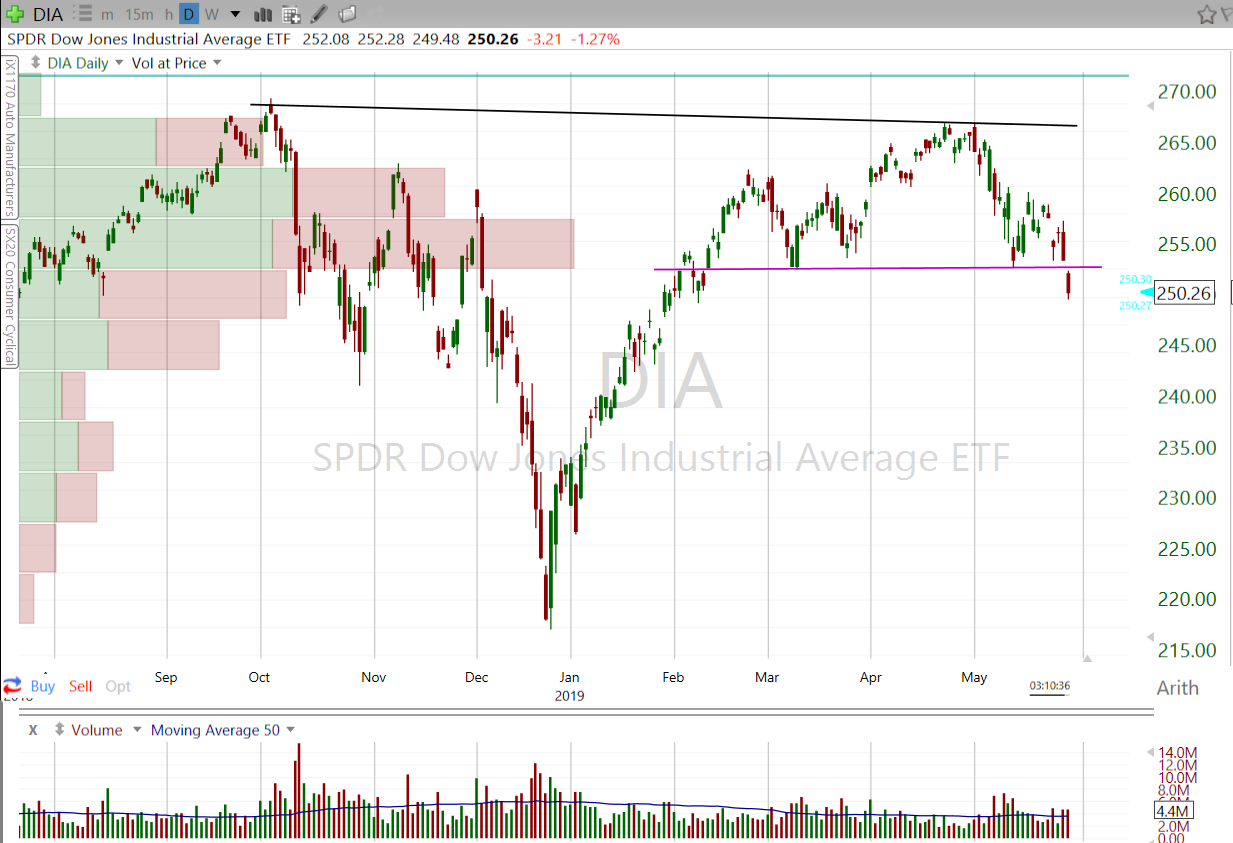
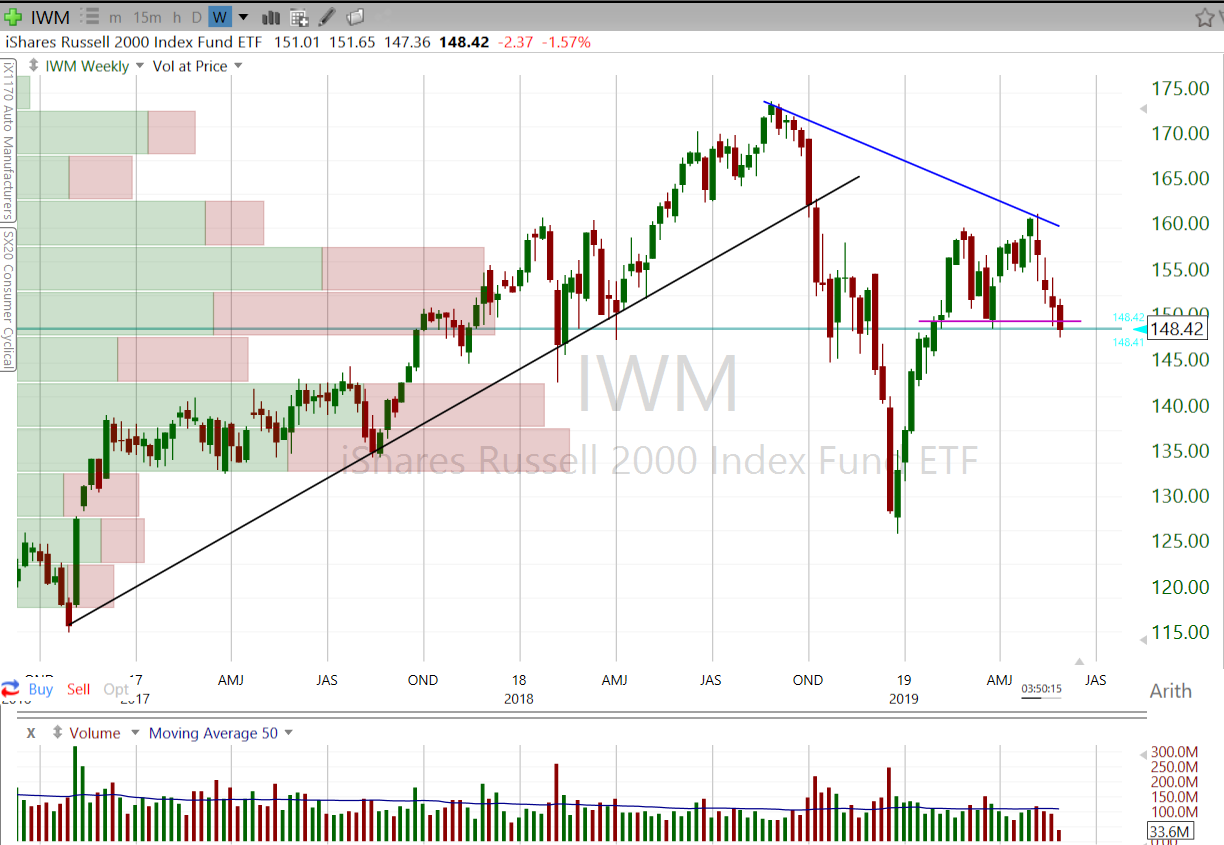
| And the Russell has company. As we see from Figure 2, the Dow Jones Industrial Average ETF (DIA) shows another bearish Head & Shoulders top pattern also confirmed May 29, 2019. From a longer-term perspective, the most recent DT pattern is just the latest sign of weakening. As we see in Figure 3, the first real sign of trend trouble happened in December when the uptrend support line was broken on above average volume. |

|
| |
| There is a chance that stocks could recover and the rally that began in March 2009 continue. But unless the current bearish patterns are invalidated and a new uptrend line forms, it is more likely that there is more weakness ahead. |
Matt Blackman is a full-time technical and financial writer and trader. He produces corporate and financial newsletters, and assists clients in getting published in the mainstream media. Matt has earned the Chartered Market Technician (CMT) designation. Follow Matt on Twitter at www.twitter.com/RatioTrade
| Title: | Author |
| Company: | TradeSystemGuru |
| Address: | Box 2589 |
| Garibaldi Highlands, BC V0N1T0 | |
| Phone # for sales: | 6048989069 |
| E-mail address: | indextradermb@gmail.com |
Traders' Resource Links | |
| TradeSystemGuru has not added any product or service information to TRADERS' RESOURCE. | |
Click here for more information about our publications!
PRINT THIS ARTICLE

|

Request Information From Our Sponsors
- StockCharts.com, Inc.
- Candle Patterns
- Candlestick Charting Explained
- Intermarket Technical Analysis
- John Murphy on Chart Analysis
- John Murphy's Chart Pattern Recognition
- John Murphy's Market Message
- MurphyExplainsMarketAnalysis-Intermarket Analysis
- MurphyExplainsMarketAnalysis-Visual Analysis
- StockCharts.com
- Technical Analysis of the Financial Markets
- The Visual Investor
- VectorVest, Inc.
- Executive Premier Workshop
- One-Day Options Course
- OptionsPro
- Retirement Income Workshop
- Sure-Fire Trading Systems (VectorVest, Inc.)
- Trading as a Business Workshop
- VectorVest 7 EOD
- VectorVest 7 RealTime/IntraDay
- VectorVest AutoTester
- VectorVest Educational Services
- VectorVest OnLine
- VectorVest Options Analyzer
- VectorVest ProGraphics v6.0
- VectorVest ProTrader 7
- VectorVest RealTime Derby Tool
- VectorVest Simulator
- VectorVest Variator
- VectorVest Watchdog
