HOT TOPICS LIST
- MACD
- Fibonacci
- RSI
- Gann
- ADXR
- Stochastics
- Volume
- Triangles
- Futures
- Cycles
- Volatility
- ZIGZAG
- MESA
- Retracement
- Aroon
INDICATORS LIST
LIST OF TOPICS
PRINT THIS ARTICLE
by Fawad Razaqzada
Gold's mid-week reversal (5/15/2019) is a prime example of the topic I discussed earlier this month, namely the failure of technical patterns.
Position: N/A
Fawad Razaqzada
Fawad Razaqzada is an experienced analyst and economist having been involved in the financial markets since 2010 working for leading global FX and CFD brokerages. Having graduated with a degree in economics and leveraging years of financial market experience, Fawad provides retail and professional traders worldwide with succinct fundamental & technical analysis. In addition, he also offers premium trade signals to subscribers, and trading education to help shorten the learning curves of developing traders. He has also been trading on his personal account for many years. Follow Fawad on twitter @Trader_F_R or visit his website at TradingCandles.com.
PRINT THIS ARTICLE
GOLD & METALS
Key Reversal Week For Gold
05/23/19 03:39:13 PMby Fawad Razaqzada
Gold's mid-week reversal (5/15/2019) is a prime example of the topic I discussed earlier this month, namely the failure of technical patterns.
Position: N/A
| Earlier last week, gold attempted to break higher amid raised geological risks concerning the US, China and Iran. However, despite this, gold was set to end the week on the back foot after a sharp mid-week reversal. Investors were apparently more concerned about the prospects of lower physical demand from emerging market (EM) economies, than to hold gold because of its haven properties. Indeed, it was a rough week for EM currencies, with China's yuan taking the brunt of the sell-off as the US-China trade dispute escalated. Weakness in the yuan and other EM currencies makes the dollar-denominated precious metal dearer to purchase in these nations. |
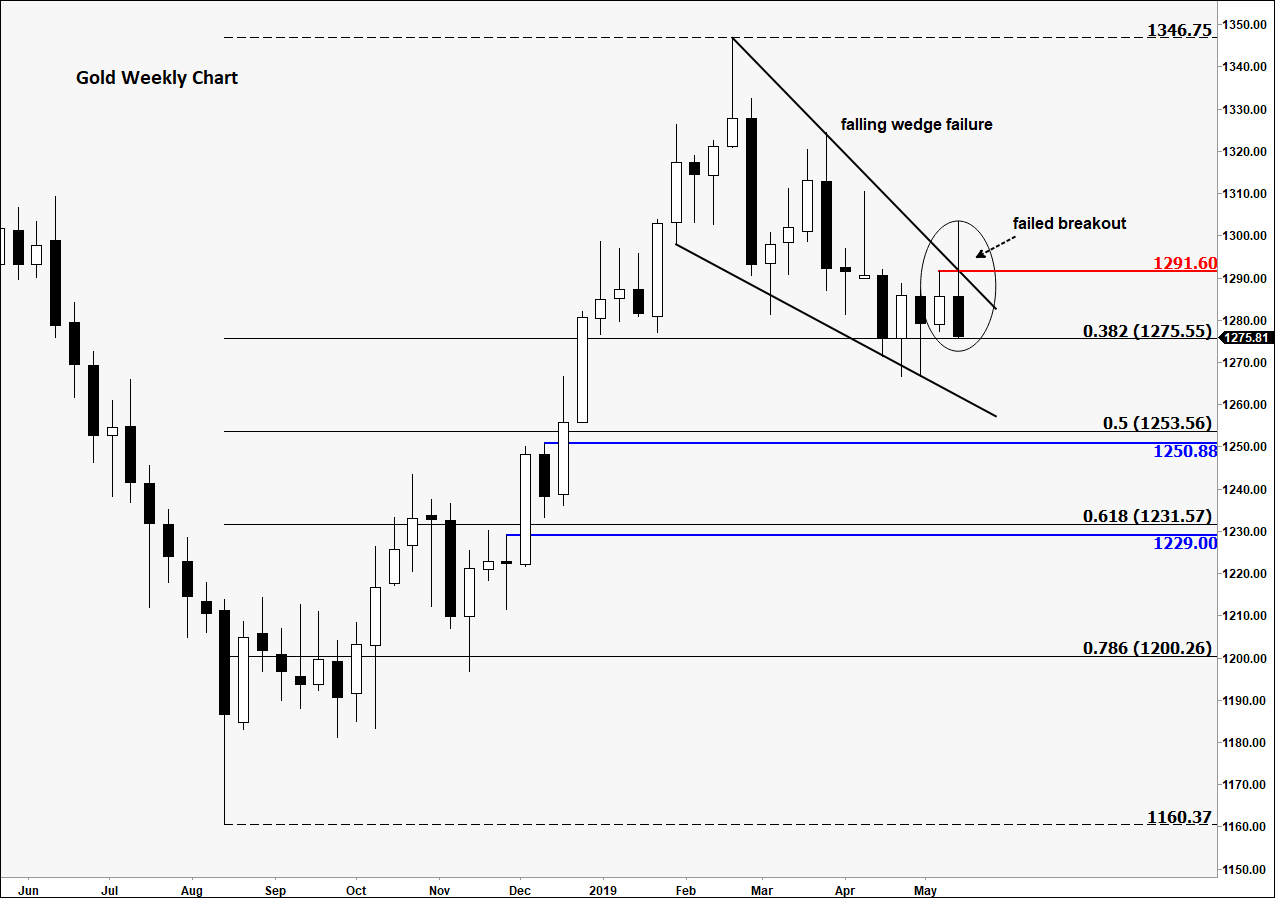
| Gold's mid-week reversal is in fact a prime example of the topic I discussed earlier this month, namely the failure of technical patterns. As can be seen from the weekly chart of gold in Figure 1, the metal attempted to break above its falling wedge pattern earlier this week. Despite the name, a falling wedge pattern is meant to be a bullish continuation formation. However, the breakout above the trend line and the previous week's high at $1291.60 didn't hold. Consequently, the metal dropped sharply to eventually take out liquidity below the previous week's low (around $1277) where stop loss orders from some of the bullish speculators were undoubtedly resting. |

|
| Figure 1: Gold's failed breakout attempt. |
| Graphic provided by: eSignal. |
| |
| As a result of this week's failed breakout attempt, gold is currently displaying a rather bearish-looking weekly formation, namely a bearish outside/inverted hammer candle. Given the failure of the wedge pattern and the shape of this candlestick formation, there is no technical reason for me to believe it will rise back again next week (5/20-5/24). Consequently, we could see further losses in the upcoming week and possibly beyond. |
| A couple of levels to watch on the way down include $1250.1 and $1229.30. These were previous resistance levels that have not been re-tested as support on the weekly time frame. In addition, it is worth watching the Fibonacci retracement levels, especially the 61.8% which coincides with the aforementioned $1229.30 level. We could see gold react around these levels, should it get there. |
| As things stand therefore, the path of least resistance is to the downside. However, in the event gold recovers and rises back above that $1291.60 level, then in that case, it would re-instate its bullish bias. Until that happens, or we see some other bullish patterns emerge at lower levels first, I will remain bearish on gold even if we see a small bounce in early next week. |
Fawad Razaqzada is an experienced analyst and economist having been involved in the financial markets since 2010 working for leading global FX and CFD brokerages. Having graduated with a degree in economics and leveraging years of financial market experience, Fawad provides retail and professional traders worldwide with succinct fundamental & technical analysis. In addition, he also offers premium trade signals to subscribers, and trading education to help shorten the learning curves of developing traders. He has also been trading on his personal account for many years. Follow Fawad on twitter @Trader_F_R or visit his website at TradingCandles.com.
| Title: | Financial Market Analyst |
| Company: | TradingCandles.com |
| London, | |
| Website: | tradingcandles.com |
| E-mail address: | fawad.razaqzada@hotmail.co.uk |
Traders' Resource Links | |
| TradingCandles.com has not added any product or service information to TRADERS' RESOURCE. | |
Click here for more information about our publications!
PRINT THIS ARTICLE

Request Information From Our Sponsors
- StockCharts.com, Inc.
- Candle Patterns
- Candlestick Charting Explained
- Intermarket Technical Analysis
- John Murphy on Chart Analysis
- John Murphy's Chart Pattern Recognition
- John Murphy's Market Message
- MurphyExplainsMarketAnalysis-Intermarket Analysis
- MurphyExplainsMarketAnalysis-Visual Analysis
- StockCharts.com
- Technical Analysis of the Financial Markets
- The Visual Investor
- VectorVest, Inc.
- Executive Premier Workshop
- One-Day Options Course
- OptionsPro
- Retirement Income Workshop
- Sure-Fire Trading Systems (VectorVest, Inc.)
- Trading as a Business Workshop
- VectorVest 7 EOD
- VectorVest 7 RealTime/IntraDay
- VectorVest AutoTester
- VectorVest Educational Services
- VectorVest OnLine
- VectorVest Options Analyzer
- VectorVest ProGraphics v6.0
- VectorVest ProTrader 7
- VectorVest RealTime Derby Tool
- VectorVest Simulator
- VectorVest Variator
- VectorVest Watchdog
