HOT TOPICS LIST
- MACD
- Fibonacci
- RSI
- Gann
- ADXR
- Stochastics
- Volume
- Triangles
- Futures
- Cycles
- Volatility
- ZIGZAG
- MESA
- Retracement
- Aroon
INDICATORS LIST
LIST OF TOPICS
PRINT THIS ARTICLE
by Fawad Razaqzada
What should you do when a candle pattern does not behave as expected? Here's a closer look at the shooting star.
Position: N/A
Fawad Razaqzada
Fawad Razaqzada is an experienced analyst and economist having been involved in the financial markets since 2010 working for leading global FX and CFD brokerages. Having graduated with a degree in economics and leveraging years of financial market experience, Fawad provides retail and professional traders worldwide with succinct fundamental & technical analysis. In addition, he also offers premium trade signals to subscribers, and trading education to help shorten the learning curves of developing traders. He has also been trading on his personal account for many years. Follow Fawad on twitter @Trader_F_R or visit his website at TradingCandles.com.
PRINT THIS ARTICLE
FALSE MOVES
Trading The Failure Of Candle Patterns: Shooting Star
05/30/19 04:05:44 PMby Fawad Razaqzada
What should you do when a candle pattern does not behave as expected? Here's a closer look at the shooting star.
Position: N/A
| In my previous article for Traders.com Advantage, I discussed the concept of trading technical patterns and how to take advantage of them. Specifically, the topic was about fading the double top patterns. However, the same concept could be applied to other technical patterns, too. In fact, it can also be applied to candlestick patterns, which is the topic of this article. Just like fading typical text-book technical patterns, doing the same to candlestick formations can be an alternative way of looking for really nice trade ideas — although it still does require some thinking outside the box and a deeper level of understanding of price action. |
| The idea is simple, though. Once it becomes apparent that a super bearish- or bullish-looking candle, like a hammer or doji, has failed to work like it should have, the most important point to remember is that you now have an idea where the market should be going to, i.e. where the trapped traders' stop loss orders would be resting. With this clear objective, you now know where your ideal target will be. Meanwhile, the stop loss location is likewise easy to identify: a level were price shouldn't go to if your analysis is correct. Thus, you don't need to worry too much about getting a perfect entry, although keeping the risk-to-reward ratio as low as possible would still be important. |
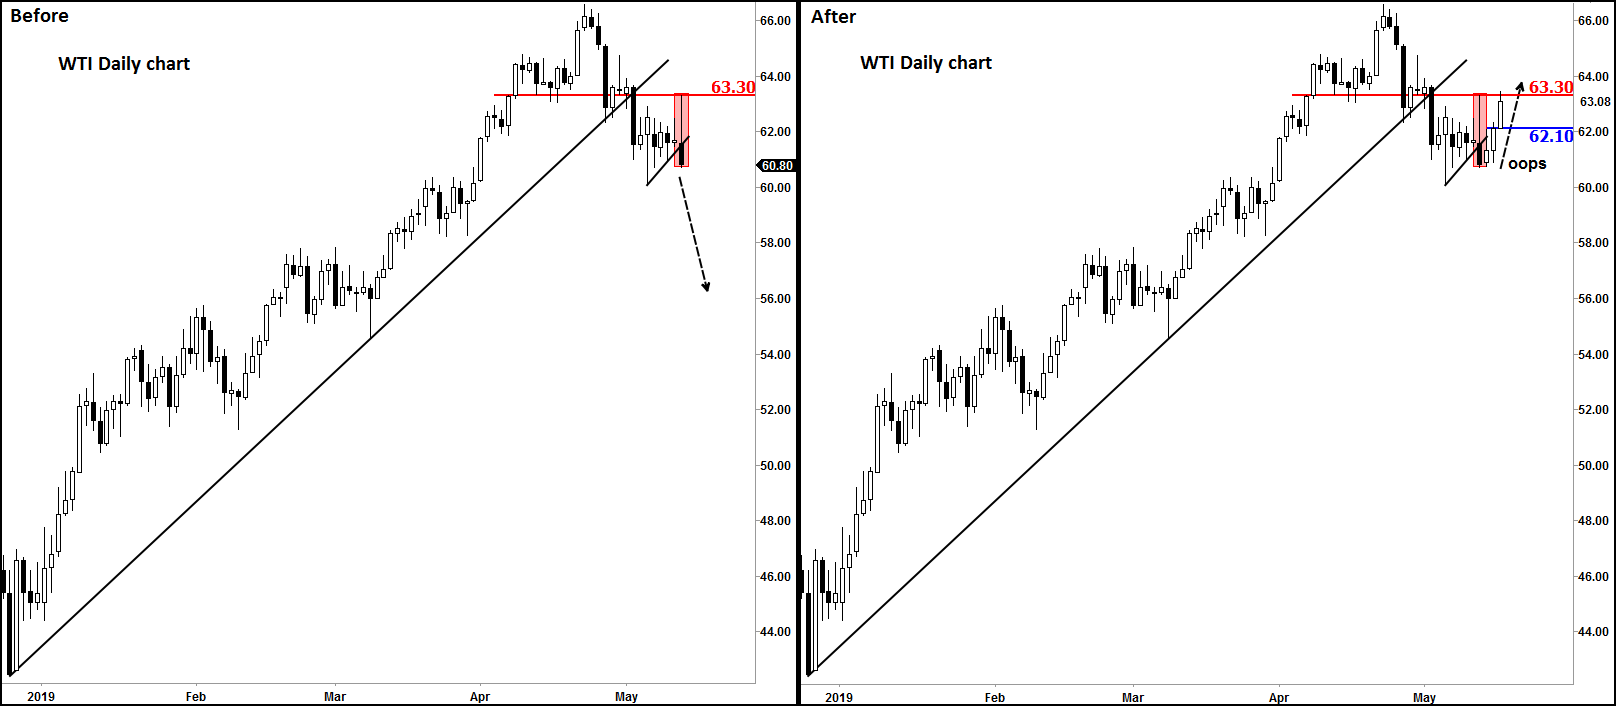
| For example, if after the formation of a daily bearish-looking shooting star candle you thought that price should have gone down but didn't, you could take advantage of this failure by looking for buying opportunities. Your target would be the liquidity (seller's stop loss orders) that would be resting above the shooting star candle. Have a look at this daily chart of WTI crude oil in Figure 1, which illustrates the point above perfectly. |

|
| Figure 1. WTI Daily Chart. |
| Graphic provided by: eSignal. |
| |
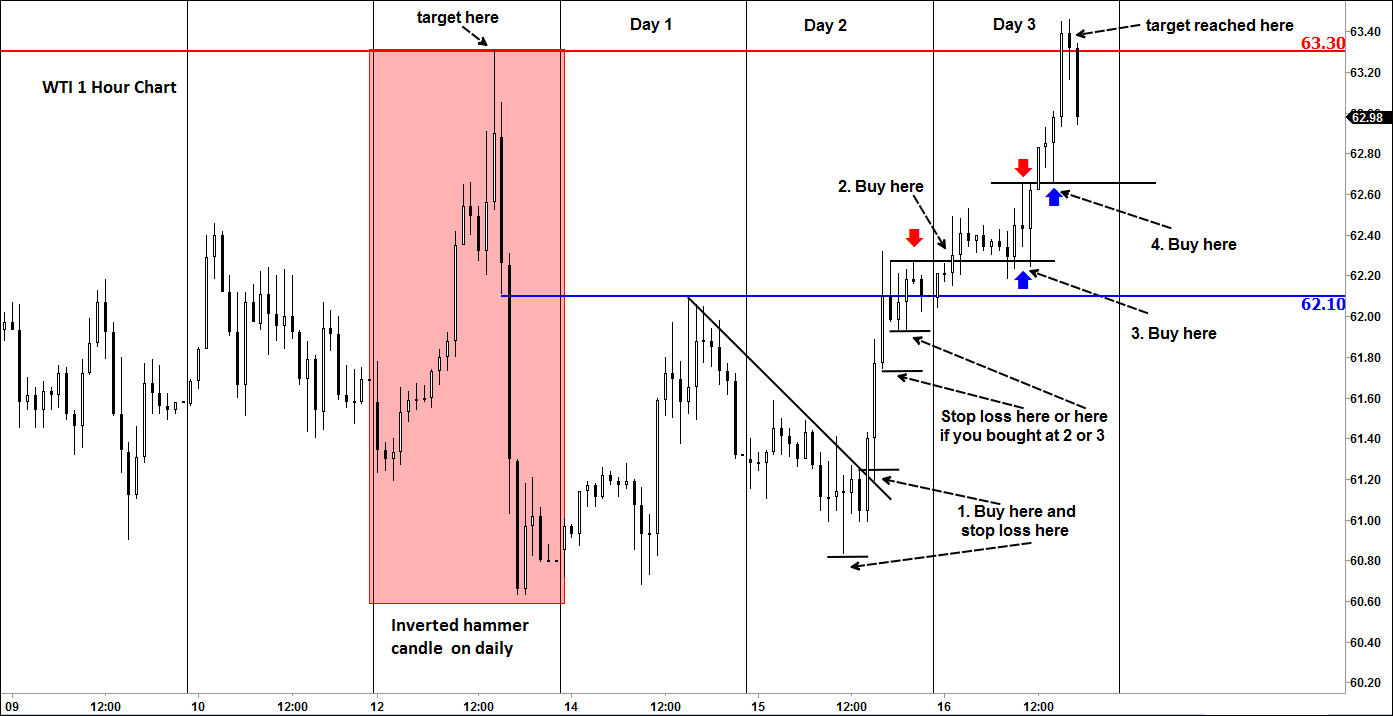
| As can be seen, WTI formed a large inverted hammer candle on its daily chart on May 13, 2019, when resistance at $63.30 held and caused prices to tumble. But as the updated chart shows, there was no follow through to the downside. After such a bearish-looking price pattern, oil prices should have fallen further the very next day. But instead, we had two days of consolidation with price finding interim resistance around $62.10, before rising to take out the buy stops above the high of that inverted hammer candle and resistance at $63.30, on day 3. Now how would you have taken advantage of the above example? Well, here is how I would have looked for bullish setups on the hourly (H1) chart in Figure 2. |

|
| Figure 2. WTI Hourly Chart. |
| Graphic provided by: eSignal. |
| |
| I suppose the first real bullish sign we saw was when WTI broke above the short-term bearish trend line on the intraday chart, on day 2. You could have bought the breakout or the rounded re-test of the broken H1 resistance, with a tight stop loss just below the thrust candle that led to the breakout. In all cases, the target would have been above the high of that daily inverted hammer candle and resistance at $63.30, which was eventually taken out on day 3. Notice how tight the stop loss orders could have been relative to entry and how wide the targets were, giving you very nice lop-sided risk-to-reward trades. Even if one of the buy trades were taken, it would have been worth it, purely from a risk-to-reward point of view. But imagine taking all these trades, and in each case adjusting the stop loss order higher as price moved north! This way of pyramiding into a trade that you have a high conviction on vastly increases the profit potential while keeping risks low. But it all started with that failure of the daily bearish candle, from which all these ideas came about on the hourly chart. |
Fawad Razaqzada is an experienced analyst and economist having been involved in the financial markets since 2010 working for leading global FX and CFD brokerages. Having graduated with a degree in economics and leveraging years of financial market experience, Fawad provides retail and professional traders worldwide with succinct fundamental & technical analysis. In addition, he also offers premium trade signals to subscribers, and trading education to help shorten the learning curves of developing traders. He has also been trading on his personal account for many years. Follow Fawad on twitter @Trader_F_R or visit his website at TradingCandles.com.
| Title: | Financial Market Analyst |
| Company: | TradingCandles.com |
| London, | |
| Website: | tradingcandles.com |
| E-mail address: | fawad.razaqzada@hotmail.co.uk |
Traders' Resource Links | |
| TradingCandles.com has not added any product or service information to TRADERS' RESOURCE. | |
Click here for more information about our publications!
PRINT THIS ARTICLE

Request Information From Our Sponsors
- StockCharts.com, Inc.
- Candle Patterns
- Candlestick Charting Explained
- Intermarket Technical Analysis
- John Murphy on Chart Analysis
- John Murphy's Chart Pattern Recognition
- John Murphy's Market Message
- MurphyExplainsMarketAnalysis-Intermarket Analysis
- MurphyExplainsMarketAnalysis-Visual Analysis
- StockCharts.com
- Technical Analysis of the Financial Markets
- The Visual Investor
- VectorVest, Inc.
- Executive Premier Workshop
- One-Day Options Course
- OptionsPro
- Retirement Income Workshop
- Sure-Fire Trading Systems (VectorVest, Inc.)
- Trading as a Business Workshop
- VectorVest 7 EOD
- VectorVest 7 RealTime/IntraDay
- VectorVest AutoTester
- VectorVest Educational Services
- VectorVest OnLine
- VectorVest Options Analyzer
- VectorVest ProGraphics v6.0
- VectorVest ProTrader 7
- VectorVest RealTime Derby Tool
- VectorVest Simulator
- VectorVest Variator
- VectorVest Watchdog
