

HOT TOPICS LIST
- MACD
- Fibonacci
- RSI
- Gann
- ADXR
- Stochastics
- Volume
- Triangles
- Futures
- Cycles
- Volatility
- ZIGZAG
- MESA
- Retracement
- Aroon
INDICATORS LIST
LIST OF TOPICS
PRINT THIS ARTICLE
by Stella Osoba, CMT
"When elephants fight it is the grass that gets trampled."
African proverb
The world's two largest economies are fighting and it is not pretty. Let me rephrase that, the leaders of the two largest economies in the world are engaged in a down-and-out mean and scrappy brawl. As they throw their considerable muscle and might around, it is the ordinary people who inhabit those two economies that are getting trampled. How bad will it be? Will a sudden truce send markets soaring in a relief rally? Will any of this even matter? Was the uptrend already over even before the current spat between Trump and Xi Jinping?
Position: N/A
Stella Osoba, CMT
Stella Osoba is a trader and financial writer. She is a frequent contributor to "Technical Analysis of Stocks and Commodities" magazine and "Traders.com Advantage" as well as other financial publications.
PRINT THIS ARTICLE
TECHNICAL ANALYSIS
When Elephants Fight
05/23/19 03:28:04 PMby Stella Osoba, CMT
"When elephants fight it is the grass that gets trampled."
African proverb
The world's two largest economies are fighting and it is not pretty. Let me rephrase that, the leaders of the two largest economies in the world are engaged in a down-and-out mean and scrappy brawl. As they throw their considerable muscle and might around, it is the ordinary people who inhabit those two economies that are getting trampled. How bad will it be? Will a sudden truce send markets soaring in a relief rally? Will any of this even matter? Was the uptrend already over even before the current spat between Trump and Xi Jinping?
Position: N/A
| News is often noise, except when it isn't. The current tariff war instigated by Trump has many worrying that his foe is not going to be a push-over. China has responded with tariffs of its own saying that it will not "forfeit the country's respect, and no one should expect China to swallow bitter fruit that harms its core interests." Market participants, who until now have been onlookers, were convinced that the prancing and posturing of these two leaders was little more than showmanship and everything would work itself out in the end. But that the war has escalated has caused the market to react with alarm and nothing short of panic. This is evidenced by the fact that on one day, May 13, 2019, the DOW lost 618 points. And the rout may not yet be over. |
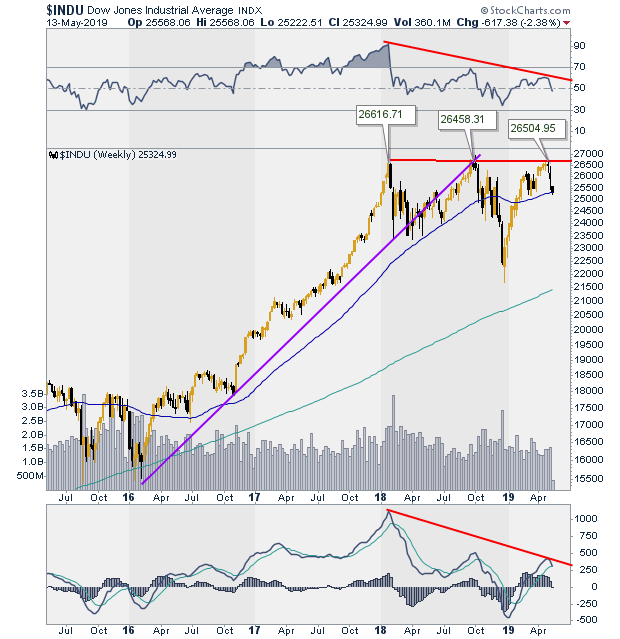
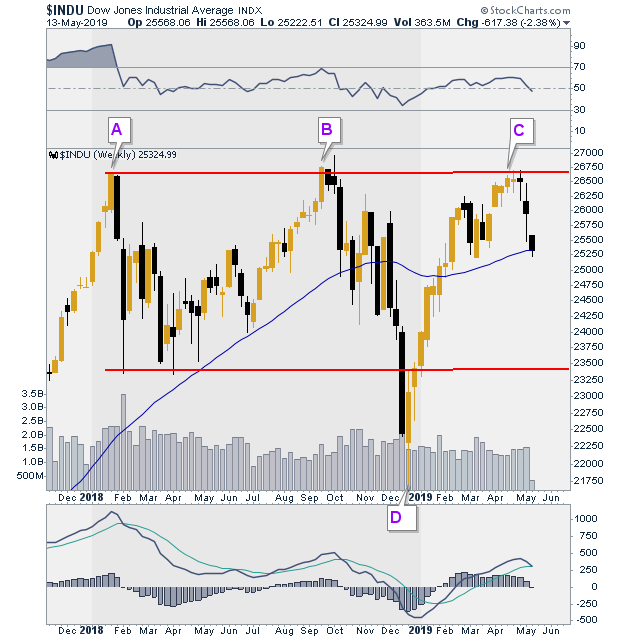
| Price charts, when we learn to trust them, can reveal information which foretells of what is to come. Figure 1 shows a weekly price chart of the Dow. We can clearly see that it has formed a triple top which is a bearish reversal pattern. The triple top started forming in January 2018 when it made its first top (See A on Figure 2). We could not have known then that a triple top was forming, but the break of the uptrend line as shown on Figure 1 should have alerted us to pay close attention. The second top formed in September 2018 (See B on Figure 2). The third top, marked C on Figure 2, was formed in April 2019. Triple tops are formed after uptrends, because as a reversal pattern, there must be a trend to reverse. Figure 1 shows the strong uptrend which lasted from April 2016 to January 2018. |
|
| Figure 1. Weekly DOW Chart. |
| Graphic provided by: StockCharts.com. |
| |
| So what is next for price? Figure 2 shows the channel price has mostly stayed in for the last year and a half. If the current down leg extends to break the lower line of the channel or support, then it is likely that we are in for more downside price action. It is also likely that if that scenario plays out, any rebounds will use the support line as future resistance and price will see further lows. |
|
| Figure 2. Triple Top Formation On Weekly DOW Chart. |
| Graphic provided by: StockCharts.com. |
| |
| But patience here is key. A breakout to the upside is still a possibility. Even though we can see the triple top forming, the pattern is not complete until price has broken the key support line which is the lower line of the channel or a close below the low at D marked on Figure 2. Elephants will sometimes fight, and as the old proverb says, it is best to stand on the side lines to avoid being trampled. When the fight is over will be the time to assess the damage, which might be slight or it might be more technically worrying. Only time will tell. |
Stella Osoba is a trader and financial writer. She is a frequent contributor to "Technical Analysis of Stocks and Commodities" magazine and "Traders.com Advantage" as well as other financial publications.
| E-mail address: | stellaosoba@gmail.com |
Click here for more information about our publications!
PRINT THIS ARTICLE

Request Information From Our Sponsors
- StockCharts.com, Inc.
- Candle Patterns
- Candlestick Charting Explained
- Intermarket Technical Analysis
- John Murphy on Chart Analysis
- John Murphy's Chart Pattern Recognition
- John Murphy's Market Message
- MurphyExplainsMarketAnalysis-Intermarket Analysis
- MurphyExplainsMarketAnalysis-Visual Analysis
- StockCharts.com
- Technical Analysis of the Financial Markets
- The Visual Investor
- VectorVest, Inc.
- Executive Premier Workshop
- One-Day Options Course
- OptionsPro
- Retirement Income Workshop
- Sure-Fire Trading Systems (VectorVest, Inc.)
- Trading as a Business Workshop
- VectorVest 7 EOD
- VectorVest 7 RealTime/IntraDay
- VectorVest AutoTester
- VectorVest Educational Services
- VectorVest OnLine
- VectorVest Options Analyzer
- VectorVest ProGraphics v6.0
- VectorVest ProTrader 7
- VectorVest RealTime Derby Tool
- VectorVest Simulator
- VectorVest Variator
- VectorVest Watchdog