HOT TOPICS LIST
- MACD
- Fibonacci
- RSI
- Gann
- ADXR
- Stochastics
- Volume
- Triangles
- Futures
- Cycles
- Volatility
- ZIGZAG
- MESA
- Retracement
- Aroon
INDICATORS LIST
LIST OF TOPICS
PRINT THIS ARTICLE
by Gary Grosschadl
The descending triangle is a bearish formation that typically forms during a downtrend as a continuation pattern.
Position: N/A
Gary Grosschadl
Independent Canadian equities trader and technical analyst based in Peterborough
Ontario, Canada.
PRINT THIS ARTICLE
DESCENDING TRIANGLES
Airline Index In Descent
12/19/02 11:42:53 AMby Gary Grosschadl
The descending triangle is a bearish formation that typically forms during a downtrend as a continuation pattern.
Position: N/A
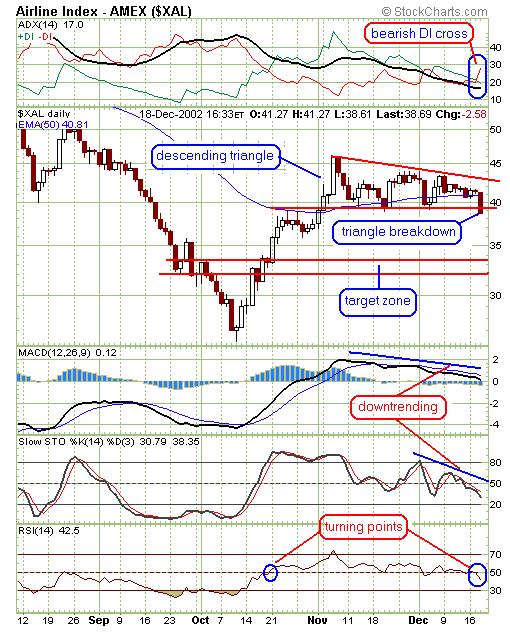
| Despite its prior run up, the airline sector has its share of problems and the recent rise in oil price only adds to this. Today's bearish action resulting in a decline of 2.58 points has the look of a bearish pattern (descending triangle) starting to fulfill. By measuring the widest part of the triangle, I get an approximation of the size of the potential decline should the expected pattern complete. This takes the index down to the target zone as shown. The zone encompasses this measure down to about 32 and possible significant candlestick points. |
| The directional movment indicator ADX/DI shows a bearish crossing of the DIs which adds fuel to the bearish fire. When -DI is overhead it is a sign that the bears have the upper hand. Watch the ADX line - should it rise in between the DIs, then this strengthens the current bearish trend leading to further decline. The RSI (relative strength index) shows a bearish move below the 50 level. Movements above and below this threshold often confirm bearish or bullish sentiment. The other two displayed indicators (MACD & stochastics) have also been pointing downhill, hinting at a bearish outcome. |

|
| Graphic provided by: StockCharts.com. |
| |
| In summary, unless this index immediately reverses course, a likely descending triangle pattern decline will move to fulfillment. This can take it down to the low 30s. Consideration should also be given to possible support at the 35 level but this could turn out to be very temporary. Look for a strong reversal pattern with confirming indicators to highlight the next reversal possibilities occurring at or near levels discussed. |
Independent Canadian equities trader and technical analyst based in Peterborough
Ontario, Canada.
| Website: | www.whatsonsale.ca/financial.html |
| E-mail address: | gwg7@sympatico.ca |
Click here for more information about our publications!
Comments
Date: 12/21/02Rank: 5Comment: It all looks so simple when you point things out in this fashion.

Request Information From Our Sponsors
- StockCharts.com, Inc.
- Candle Patterns
- Candlestick Charting Explained
- Intermarket Technical Analysis
- John Murphy on Chart Analysis
- John Murphy's Chart Pattern Recognition
- John Murphy's Market Message
- MurphyExplainsMarketAnalysis-Intermarket Analysis
- MurphyExplainsMarketAnalysis-Visual Analysis
- StockCharts.com
- Technical Analysis of the Financial Markets
- The Visual Investor
- VectorVest, Inc.
- Executive Premier Workshop
- One-Day Options Course
- OptionsPro
- Retirement Income Workshop
- Sure-Fire Trading Systems (VectorVest, Inc.)
- Trading as a Business Workshop
- VectorVest 7 EOD
- VectorVest 7 RealTime/IntraDay
- VectorVest AutoTester
- VectorVest Educational Services
- VectorVest OnLine
- VectorVest Options Analyzer
- VectorVest ProGraphics v6.0
- VectorVest ProTrader 7
- VectorVest RealTime Derby Tool
- VectorVest Simulator
- VectorVest Variator
- VectorVest Watchdog
