

HOT TOPICS LIST
- MACD
- Fibonacci
- RSI
- Gann
- ADXR
- Stochastics
- Volume
- Triangles
- Futures
- Cycles
- Volatility
- ZIGZAG
- MESA
- Retracement
- Aroon
INDICATORS LIST
LIST OF TOPICS
PRINT THIS ARTICLE
by Stella Osoba, CMT
TripAdvisor, Inc. (TRIP) is the world's largest travel website. For the quarter ended September 30, 2017, TripAdvisor's branded websites had 455 million average monthly unique visitors, or "about one in every 16 people on earth". These visitors posted reviews and opinions on 7.5 million places to stay, places to eat and things to do around the world. It will not be an exaggeration to say that TRIP "is to travel as Google is to search, as Amazon is to books, as Uber is to rides - so dominant in the travel industry, that it is almost a monopoly." TRIP has been trading on the Nasdaq since December 2011 which is enough time to to give us a reasonable amount of data to study the technicals of this internet juggernaut.
Position: N/A
Stella Osoba, CMT
Stella Osoba is a trader and financial writer. She is a frequent contributor to "Technical Analysis of Stocks and Commodities" magazine and "Traders.com Advantage" as well as other financial publications.
PRINT THIS ARTICLE
SYMMETRICAL TRIANGLE
TripAdvisor
04/24/19 12:03:03 PMby Stella Osoba, CMT
TripAdvisor, Inc. (TRIP) is the world's largest travel website. For the quarter ended September 30, 2017, TripAdvisor's branded websites had 455 million average monthly unique visitors, or "about one in every 16 people on earth". These visitors posted reviews and opinions on 7.5 million places to stay, places to eat and things to do around the world. It will not be an exaggeration to say that TRIP "is to travel as Google is to search, as Amazon is to books, as Uber is to rides - so dominant in the travel industry, that it is almost a monopoly." TRIP has been trading on the Nasdaq since December 2011 which is enough time to to give us a reasonable amount of data to study the technicals of this internet juggernaut.
Position: N/A
| Figure 1 shows a price chart of TRIP since its IPO in 2011. From a low of $20 in December 2011, TRIP rose impressively to highs of over $104 in June 2014. The ensuing downtrend took TRIP to lows of around $29 in November 2017. A look at the chart seems to show that TRIP is in the early stages of an uptrend as it is making higher lows and higher highs, allowing for the drawing of an up trend line (See green line in Figure 1). |
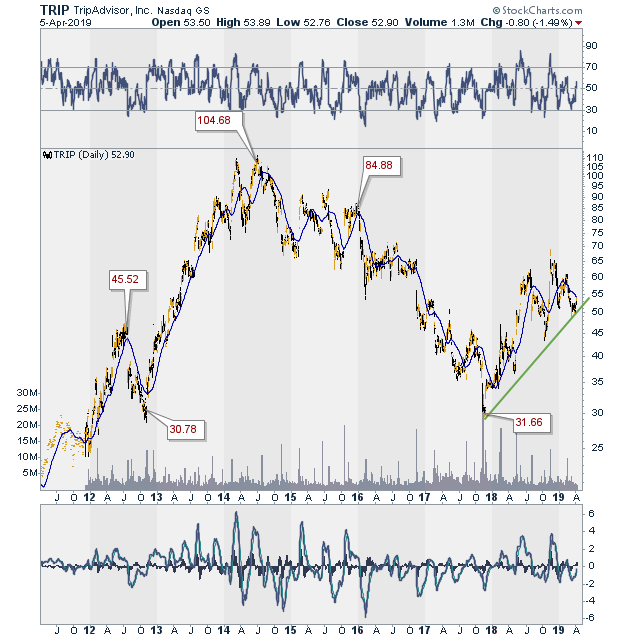
|
| Figure 1. Daily Chart For TRIP since 2011. |
| Graphic provided by: StockCharts.com. |
| |
| Figure 2 shows a closer look at the daily price chart of TRIP. This reveals a symmetrical triangle which is a coil like formation with converging lows and highs. Triangles are continuation patterns which suggests that the breakout from the pattern should be in the direction of the trend before the pattern began to form, which is upwards. Since triangles can also be reversals instead of continuation patterns, it is important to wait for breakout before determining the next major move. |
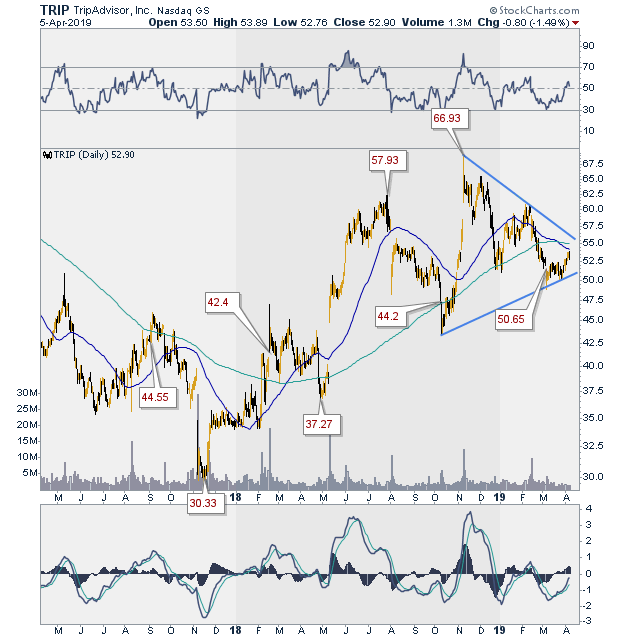
|
| Figure 2. Developing Triangle On TRIP's Daily Chart. |
| Graphic provided by: StockCharts.com. |
| |
| Triangles can give potential price targets. One way to measure the price target is to measure the widest distance of the symmetrical triangle and then project it up or down, depending on the breakout. Note that even if the breakout were down, false breakouts do happen with a certain degree of regularity. When false breakouts happen, price often will return to the breakout point before resuming in the opposite direction. When the breakout is up, look for confirmation in an expansion of volume. |
| Technical analysis is dynamic and price patterns evolve in unique and varied ways. Therefore, it is important not to treat chart patterns as mechanical formations with predetermined conclusions. |
| This analysis is for informational and educational purposes only and is not investment or trading advice. |
Stella Osoba is a trader and financial writer. She is a frequent contributor to "Technical Analysis of Stocks and Commodities" magazine and "Traders.com Advantage" as well as other financial publications.
| E-mail address: | stellaosoba@gmail.com |
Click here for more information about our publications!
PRINT THIS ARTICLE

Request Information From Our Sponsors
- VectorVest, Inc.
- Executive Premier Workshop
- One-Day Options Course
- OptionsPro
- Retirement Income Workshop
- Sure-Fire Trading Systems (VectorVest, Inc.)
- Trading as a Business Workshop
- VectorVest 7 EOD
- VectorVest 7 RealTime/IntraDay
- VectorVest AutoTester
- VectorVest Educational Services
- VectorVest OnLine
- VectorVest Options Analyzer
- VectorVest ProGraphics v6.0
- VectorVest ProTrader 7
- VectorVest RealTime Derby Tool
- VectorVest Simulator
- VectorVest Variator
- VectorVest Watchdog
- StockCharts.com, Inc.
- Candle Patterns
- Candlestick Charting Explained
- Intermarket Technical Analysis
- John Murphy on Chart Analysis
- John Murphy's Chart Pattern Recognition
- John Murphy's Market Message
- MurphyExplainsMarketAnalysis-Intermarket Analysis
- MurphyExplainsMarketAnalysis-Visual Analysis
- StockCharts.com
- Technical Analysis of the Financial Markets
- The Visual Investor