

HOT TOPICS LIST
- MACD
- Fibonacci
- RSI
- Gann
- ADXR
- Stochastics
- Volume
- Triangles
- Futures
- Cycles
- Volatility
- ZIGZAG
- MESA
- Retracement
- Aroon
INDICATORS LIST
LIST OF TOPICS
PRINT THIS ARTICLE
by Fawad Razaqzada
Using the Fibonacci tool on price action that has already unfolded can provide us with clues in terms of what to expect next when price breaks out of a range.
Position: N/A
Fawad Razaqzada
Fawad Razaqzada is an experienced analyst and economist having been involved in the financial markets since 2010 working for leading global FX and CFD brokerages. Having graduated with a degree in economics and leveraging years of financial market experience, Fawad provides retail and professional traders worldwide with succinct fundamental & technical analysis. In addition, he also offers premium trade signals to subscribers, and trading education to help shorten the learning curves of developing traders. He has also been trading on his personal account for many years. Follow Fawad on twitter @Trader_F_R or visit his website at TradingCandles.com.
PRINT THIS ARTICLE
FIBONACCI
Fibonacci Extension Clues From Past Retracements
04/04/19 04:31:21 PMby Fawad Razaqzada
Using the Fibonacci tool on price action that has already unfolded can provide us with clues in terms of what to expect next when price breaks out of a range.
Position: N/A
| In strong trends, retracements tend to be quite shallow, with price usually turning back around the 38.2% Fibonacci level. In weak trends, or when price forms a major low or high, you tend to see deeper retracements to 61.8% or 78.6% levels before it reverses. Armed with this information, breakout traders can make better informed decisions. |
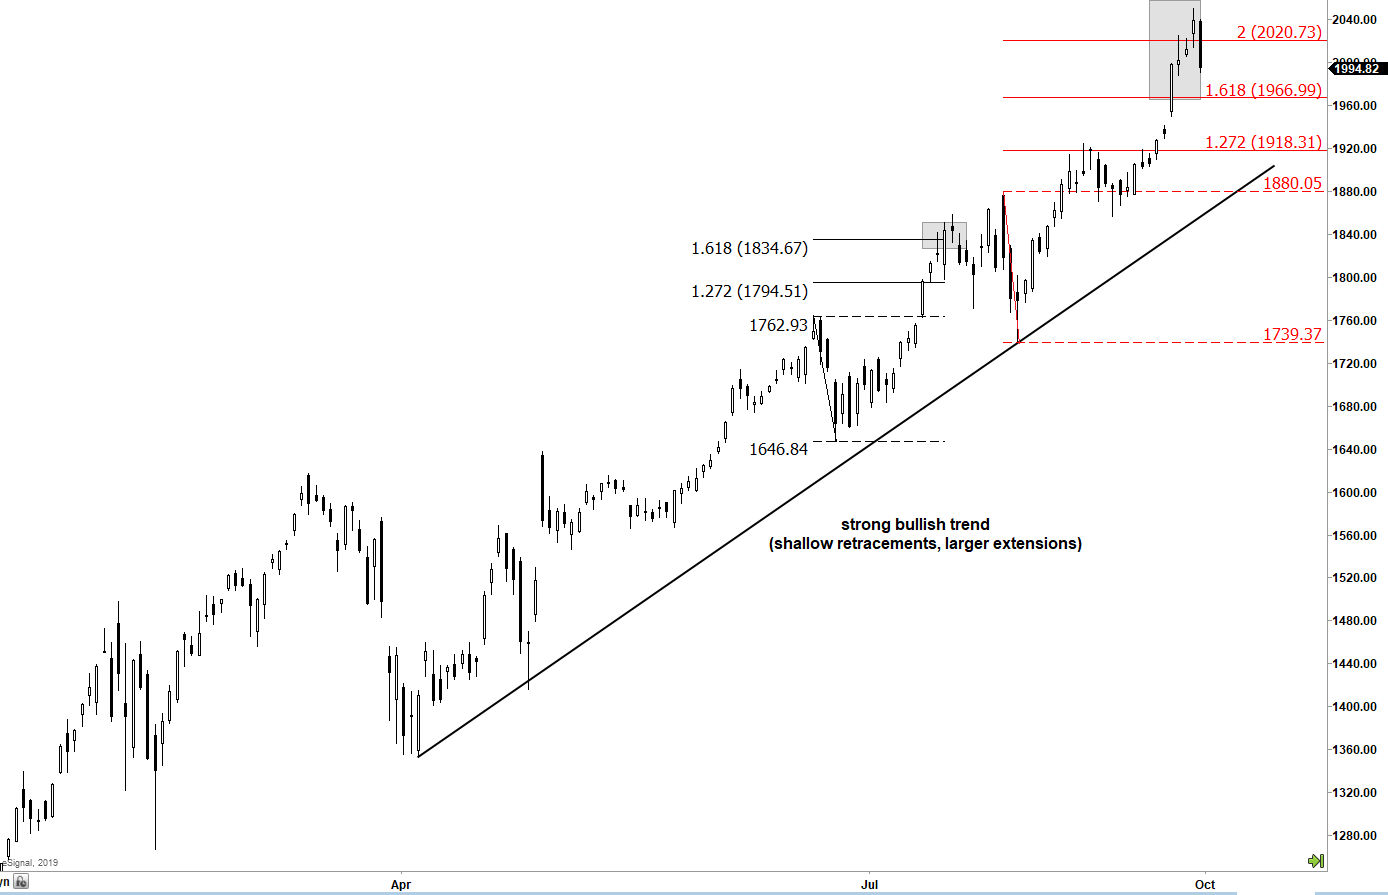
| In a strong bullish (bearish) trend, you have the buyers (sellers) dominating price action and retracements usually indicate profit-taking from this camp. In other words, short sellers (buyers) are almost non-existent or there are very few of them compared to the buyers (sellers). Thus, when price retraces and works off overbought (oversold) conditions and breaks out (down) again, new buyers (sellers) jump in and drive the market further higher (lower). The shallow pullback that preceded that breakout indicates to the breakout bullish (bearish) traders to expect a strong continuation in the up (down) trend beyond the old high (low). Therefore, the resulting extension could achieve a 161.8% Fibonacci move, rather than just, say, a 127.2% extension. Thus, breakout traders may wish to first look at the size of the retracements that preceded the breakout, in order to find optimal profit targets. This is highlighted by the rally in shares of Amazon (AMZN) in Figure 1. |
|
| Figure 1. Amazon daily chart showing example of a strong bullish trend achieving 161.8% or higher Fibonacci extensions |
| Graphic provided by: eSignal. |
| |
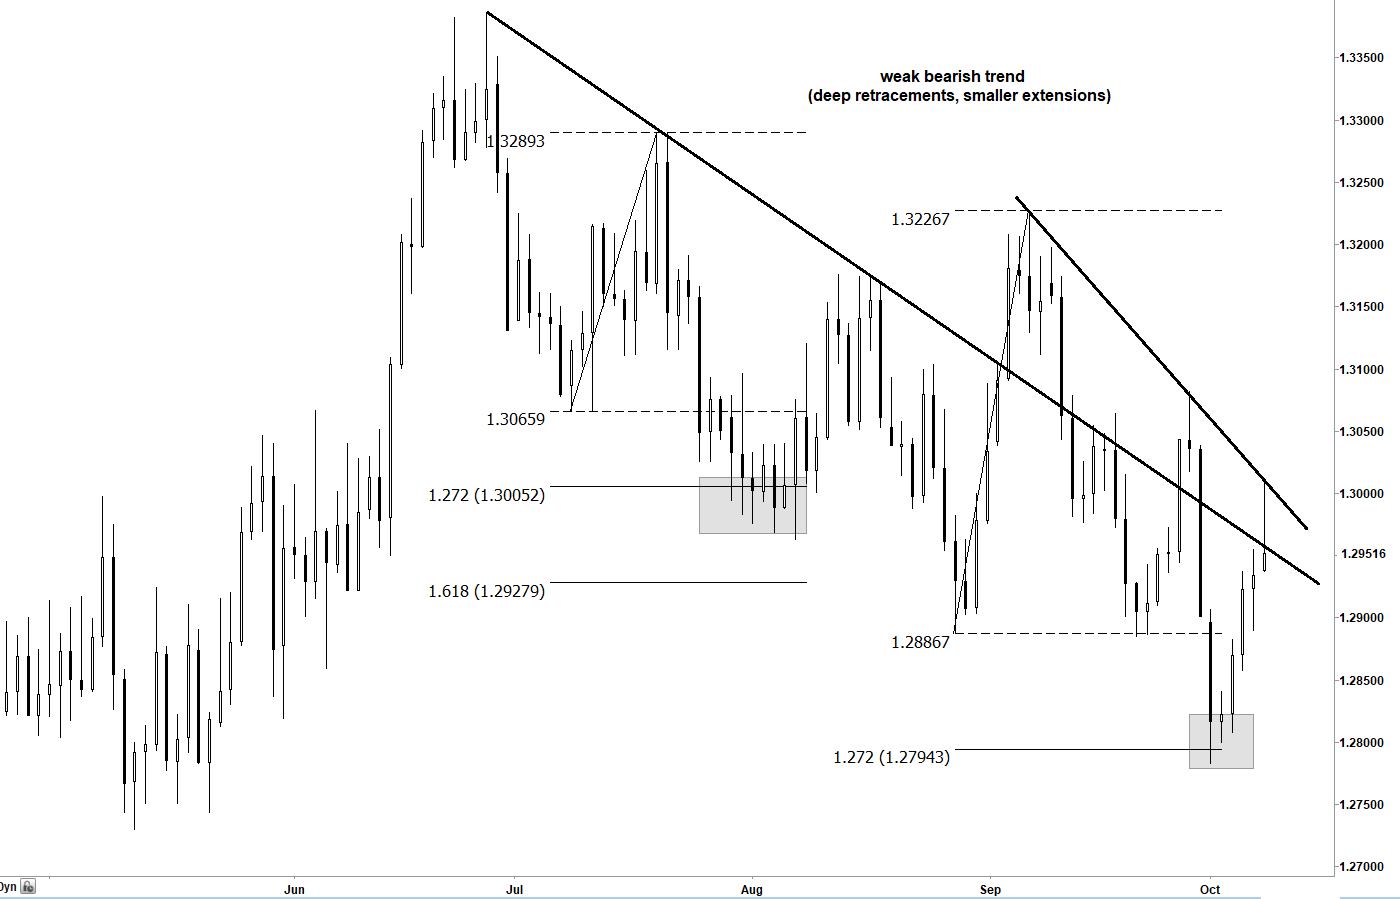
| Conversely, in weak bullish (bearish) trends, the buyers (sellers) are not fully in control of price action. The relatively deeper pullbacks indicate to the bulls (bears) to expect a weak continuation in the bullish (bearish) trend beyond the old high (low). Therefore, the resulting extension may only achieve a 127.2% Fibonacci move, rather than, say, a 161.8% extension. The chart of the USD/CAD exchange rate in Figure 2 highlights this perfectly. |
|
| Figure 2: USD/CAD Daily chart showing example of a week downtrend achieving 127.2% Fibonacci extensions. |
| Graphic provided by: eSignal. |
| |
Fawad Razaqzada is an experienced analyst and economist having been involved in the financial markets since 2010 working for leading global FX and CFD brokerages. Having graduated with a degree in economics and leveraging years of financial market experience, Fawad provides retail and professional traders worldwide with succinct fundamental & technical analysis. In addition, he also offers premium trade signals to subscribers, and trading education to help shorten the learning curves of developing traders. He has also been trading on his personal account for many years. Follow Fawad on twitter @Trader_F_R or visit his website at TradingCandles.com.
| Title: | Financial Market Analyst |
| Company: | TradingCandles.com |
| London, | |
| Website: | tradingcandles.com |
| E-mail address: | fawad.razaqzada@hotmail.co.uk |
Traders' Resource Links | |
| TradingCandles.com has not added any product or service information to TRADERS' RESOURCE. | |
Click here for more information about our publications!
Comments
Date:�04/07/19Rank:�4Comment:�

Request Information From Our Sponsors
- StockCharts.com, Inc.
- Candle Patterns
- Candlestick Charting Explained
- Intermarket Technical Analysis
- John Murphy on Chart Analysis
- John Murphy's Chart Pattern Recognition
- John Murphy's Market Message
- MurphyExplainsMarketAnalysis-Intermarket Analysis
- MurphyExplainsMarketAnalysis-Visual Analysis
- StockCharts.com
- Technical Analysis of the Financial Markets
- The Visual Investor
- VectorVest, Inc.
- Executive Premier Workshop
- One-Day Options Course
- OptionsPro
- Retirement Income Workshop
- Sure-Fire Trading Systems (VectorVest, Inc.)
- Trading as a Business Workshop
- VectorVest 7 EOD
- VectorVest 7 RealTime/IntraDay
- VectorVest AutoTester
- VectorVest Educational Services
- VectorVest OnLine
- VectorVest Options Analyzer
- VectorVest ProGraphics v6.0
- VectorVest ProTrader 7
- VectorVest RealTime Derby Tool
- VectorVest Simulator
- VectorVest Variator
- VectorVest Watchdog