

HOT TOPICS LIST
- MACD
- Fibonacci
- RSI
- Gann
- ADXR
- Stochastics
- Volume
- Triangles
- Futures
- Cycles
- Volatility
- ZIGZAG
- MESA
- Retracement
- Aroon
INDICATORS LIST
LIST OF TOPICS
PRINT THIS ARTICLE
by Stella Osoba, CMT
Chipotle Mexican Grill, Inc. (CMG) has been on a tear recently. Its share price has surged over 42% since its reversal on December 26, 2018. On January 25, 2019, the rapid rise in its share price slowed and CMG proceeded to form a flag. This short article is about the predictive qualities of flags.
Position: N/A
Stella Osoba, CMT
Stella Osoba is a trader and financial writer. She is a frequent contributor to "Technical Analysis of Stocks and Commodities" magazine and "Traders.com Advantage" as well as other financial publications.
PRINT THIS ARTICLE
FLAGS AND PENNANTS
Trading Flags
04/11/19 06:36:18 PMby Stella Osoba, CMT
Chipotle Mexican Grill, Inc. (CMG) has been on a tear recently. Its share price has surged over 42% since its reversal on December 26, 2018. On January 25, 2019, the rapid rise in its share price slowed and CMG proceeded to form a flag. This short article is about the predictive qualities of flags.
Position: N/A
| Flags are classic short term continuation patterns. You recognize them because they will often slope against the prevailing trend and can be contained in two parallel lines. Learning to recognize these patterns can be very useful because they often have predictive powers about the minimum duration of the rest of the trend. Because they are short term patterns, I prefer to trade flags that form over a week to three week period. Flags may well form over slightly longer periods, but they may not be as reliable if they just meander along for an indefinite period of time. In which case, you are looking at a different chart pattern and a different analysis should apply. |
|
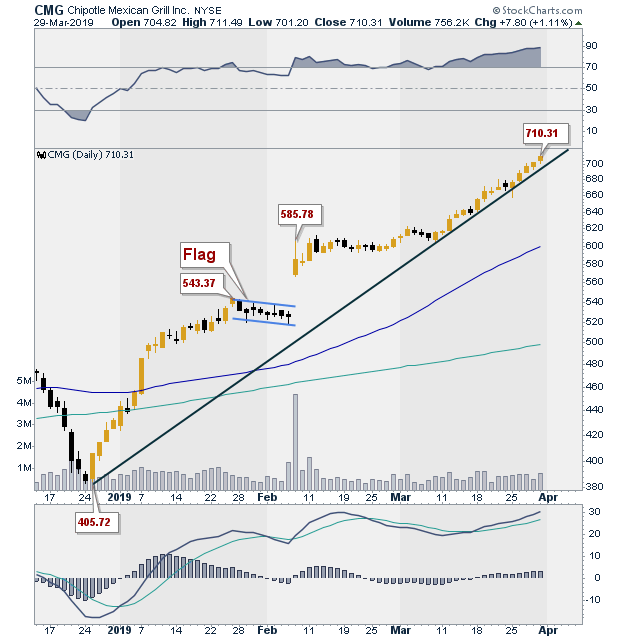
| Figure 1. Daily chart for CMG with flag pattern in the middle of an uptrend. |
| Graphic provided by: StockCharts.com. |
| |
| Using CMG as an example, Figure 1 shows CMG and its strong up trend. CMG is trading above its unbroken up trend line. It is above its 50-day moving average, and its 50-day moving average is above its 200-day moving average. The beginning of the current leg of the uptrend started on December 26, 2018. On January 25, 2019, CMG closed at 543.37. It then proceeded to slope downwards towards its 50-day moving average. Because of the earlier strength of the price move, some sort of reaction could have been expected, but what unfolded over the next 8 trading days was a classic flag pattern. |
|
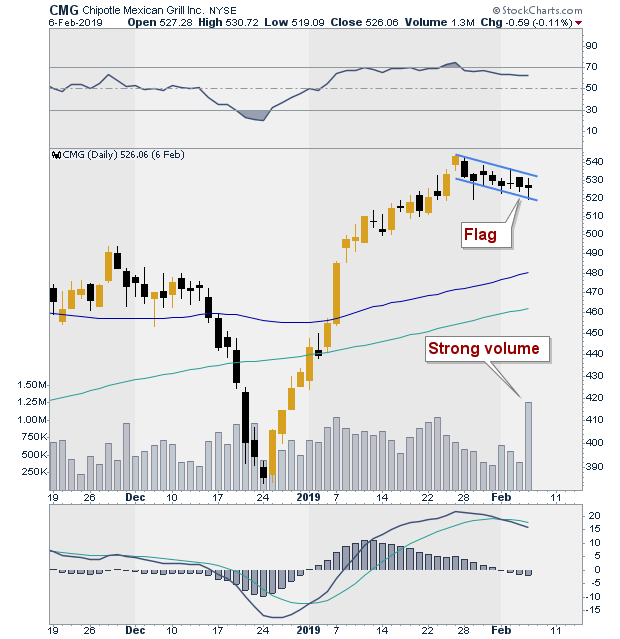
| Figure 2. Close up view of the flag pattern shown in Figure 1. |
| Graphic provided by: StockCharts.com. |
| |
| Figure 2 shows the flag in greater detail. We can clearly see that it is sloping against the prevailing trend. (A note of caution is that it is important to remember that in order for a flag to be valid, it must occur in the context of a strong trend, up or down. The flag must then proceed to slope against the trend. If the trend is up, the flag forms down, if the trend is down, the flag forms up.) You cannot predict ahead of time when a flag will complete its pattern. In this case, it actually completed its formation on February 7, 2019, when price gapped up on extremely high volume. But there was a clue as to its likely end on February 6, 2019, when volume more than tripled from 388,000 shares traded on February 5, 2019 to over 1.2 million shares traded on the 6th. |
| Once a flag pattern is complete, its predictive ability is the likelihood that the continuation of the prevailing trend will not only continue, but will also be at least as long as the length of the trend prior to the formation of the flag. (Note of caution: as this is technical analysis, nothing is guaranteed. A flag is a pattern that can help you identify a potentially successful trade, but flags can and do fail. So caution is always advised.) Figure 1 shows that after CMG completed its flag formation, price gapped up on extremely high volume and continued higher, closing on March 29, 2019, at 710.31. Note that price has currently exceeded the gains from December 26, 2018 to January 25, 2019 which was the first part of the flagpole or uptrend, before the flag began its formation. |
| This article is for informational and educational purposes only. |
Stella Osoba is a trader and financial writer. She is a frequent contributor to "Technical Analysis of Stocks and Commodities" magazine and "Traders.com Advantage" as well as other financial publications.
| E-mail address: | stellaosoba@gmail.com |
Click here for more information about our publications!
PRINT THIS ARTICLE

Request Information From Our Sponsors
- StockCharts.com, Inc.
- Candle Patterns
- Candlestick Charting Explained
- Intermarket Technical Analysis
- John Murphy on Chart Analysis
- John Murphy's Chart Pattern Recognition
- John Murphy's Market Message
- MurphyExplainsMarketAnalysis-Intermarket Analysis
- MurphyExplainsMarketAnalysis-Visual Analysis
- StockCharts.com
- Technical Analysis of the Financial Markets
- The Visual Investor
- VectorVest, Inc.
- Executive Premier Workshop
- One-Day Options Course
- OptionsPro
- Retirement Income Workshop
- Sure-Fire Trading Systems (VectorVest, Inc.)
- Trading as a Business Workshop
- VectorVest 7 EOD
- VectorVest 7 RealTime/IntraDay
- VectorVest AutoTester
- VectorVest Educational Services
- VectorVest OnLine
- VectorVest Options Analyzer
- VectorVest ProGraphics v6.0
- VectorVest ProTrader 7
- VectorVest RealTime Derby Tool
- VectorVest Simulator
- VectorVest Variator
- VectorVest Watchdog