

HOT TOPICS LIST
- MACD
- Fibonacci
- RSI
- Gann
- ADXR
- Stochastics
- Volume
- Triangles
- Futures
- Cycles
- Volatility
- ZIGZAG
- MESA
- Retracement
- Aroon
INDICATORS LIST
LIST OF TOPICS
PRINT THIS ARTICLE
by Mark Rivest
Characteristics and consequences of Expanding Flats.
Position: N/A
Mark Rivest
Independent investment advisor, trader and writer. He has written articles for Technical Analysis of Stocks & Commodities, Traders.com Advantage,Futuresmag.com and, Finance Magnates. Author of website Four Dimension Trading.
PRINT THIS ARTICLE
ELLIOTT WAVE
Elliott Wave - Expanding Flat Corrections
04/04/19 04:24:43 PMby Mark Rivest
Characteristics and consequences of Expanding Flats.
Position: N/A
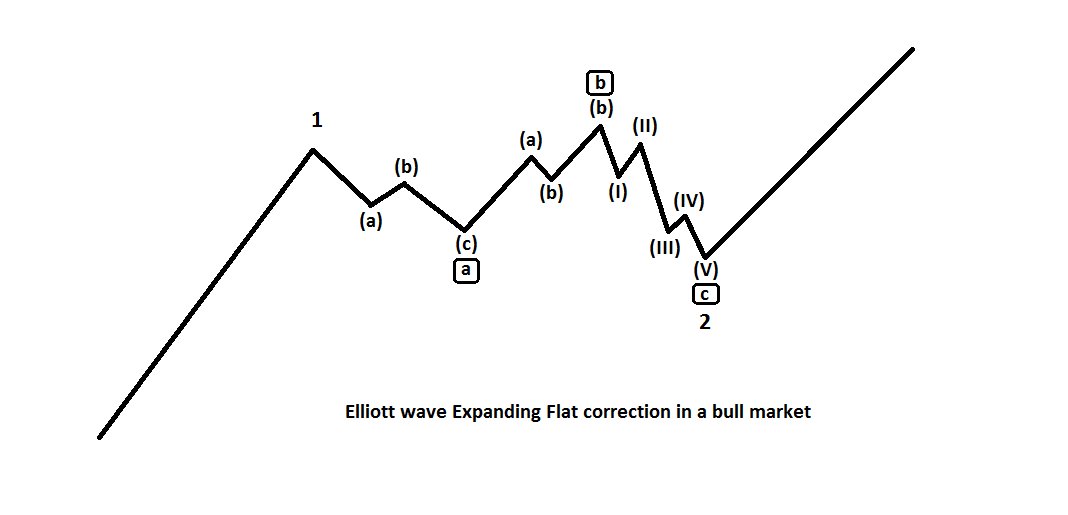
| Elliott wave theory has three types of patterns that correct the main trend: Zigzag, Triangle and, Flat. Within the Flat family there are three sub types: Expanding Flats, Running Flats, and Flats. The most common are Expanding Flats, their unique characteristics could provide valuable clues to discover market trend changes. The Pattern Expanding Flats are composed of three sub-waves as illustrated in Figure 1. The first wave "A" is composed of three waves followed by another three-wave structure, wave "B", which exceeds the wave "A" point of origin. The final wave "C" sub-divides into five waves, which exceeds the termination point of wave "A". All three sub types of the Flat family conclude with a five-wave structure, either a standard impulse wave or an Ending Diagonal Triangle. For Expanding Flats, the two most common Fibonacci relationships of wave "B" to wave "A" are 1.236 and 1.382. The two most common Fibonacci relationships of wave "C" to wave "A" are 1.618 and 2.618. For the sub type Flat correction, wave "B" is approximately equal to wave "A" and wave "C" is also approximately equal to wave "A". Running Flats are rare, wave "B" exceeds the point of origin of wave "A", however, wave "C" fails to exceed the termination point of wave "A". Expanding Flats that correct the progress of bear markets are referred to as Inverse Expanding Flats. Examples of this type will be illustrated in Figures 3 and 4. |
|
| Figure 1. All three sub types of the Flat family conclude with a five-wave structure. |
| Graphic provided by: Mark Rivest. |
| |
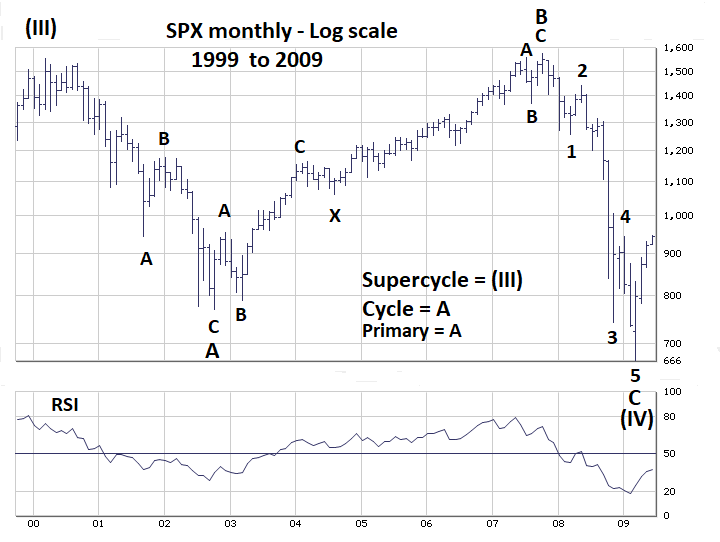
| S&P 500 - 1999 to 2009 Please see the monthly S&P 500 (SPX) chart illustrated in Figure 2. This is probably the largest Expanding Flat ever recorded, spanning nearly nine years from March 2000 to March 2009. In this example, wave "A" was a single Zigzag and wave "B" was a double Zigzag. Be aware that waves "A" and "B" may not be simple single Zigzags. They could also be double or triple Zigzags. Sometimes, wave "A" of an Expanding Flat could itself be a member of the Flat family, an example will be shown in Figure 4. On rare occasions when a market is being extra sneaky, wave "B" can take the form of a Horizontal Triangle. After Expanding Flats complete, there's usually a powerful resumption of the primary trend. This is logical because even as the Expanding Flat corrects the main trend, it's still making progress within the primary trend. Note that in 2007 the SPX exceeded the prior all-time high made in March 2000. The powerful nine-year SPX bull market after March 2009 is a perfect example of the primary trend's strong return. |
|
| Figure 2. This is probably the largest Expanding Flat ever recorded spanning nearly nine years from March 2000 to March 2009. |
| Graphic provided by: BigCharts.com. |
| |
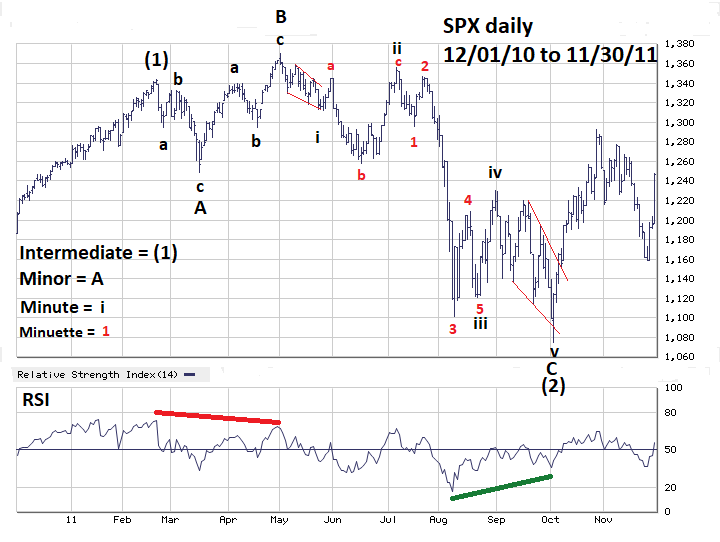
| S&P 500 - 2010 to 2011 Please see the daily SPX chart 2010 to 2011 illustrated in Figure 3. The SPX rallied in five waves from June 2010 to February 2011 then had a clear three-wave decline followed by a three-wave rally that exceeded the February 2011 peak. This, plus the bearish RSI divergence, was strong evidence a top could be forming. The initial decline was a Leading Diagonal Triangle followed by an Inverse Expanding Flat labeled as Minute wave "ii". This is a classic example of an Inverse Expanding Flat signaling a potential powerful primary trend move down. The subsequent drop after Minute wave "ii" was 18% in just 22 trading days. The larger degree Expanding Flat labeled as Intermediate wave (2) ended in October of 2011 and was the prelude a powerful and steady rise that lasted until 2015. |
|
| Figure 3. The larger degree Expanding Flat labeled as Intermediate wave (2) ended in October of 2011 and was the prelude to a powerful and steady rise that lasted until 2015. |
| Graphic provided by: BigCharts.com. |
| |
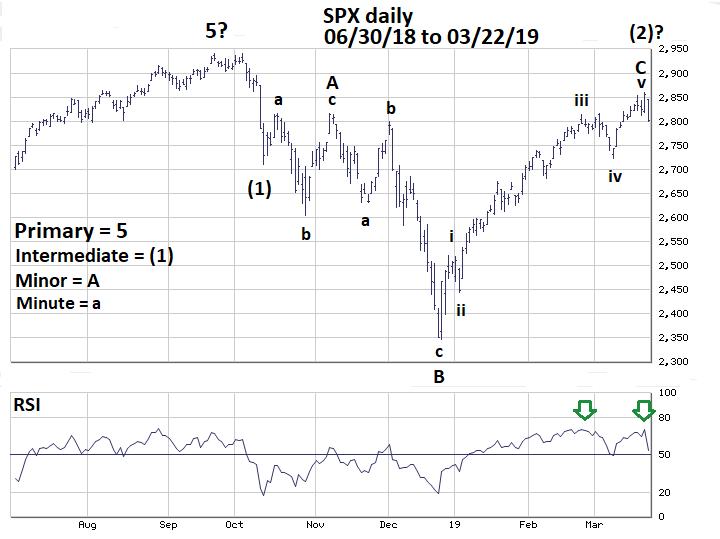
| S&P 500 - 2018 to 2019 Please see the daily SPX chart 2018 to 2019 illustrated in Figure 4. The decline from the SPX all-time high on September 21 to December 26 does not sub-divide into five waves and therefore appears to be a completed correction of the bull market that began in March of 2009. However, a case can be made that an Inverse Expanding Flat began after the October 11 short-term bottom and may have ended at the March 21 top. One very interesting note about this structure is that Minor wave "A" appears to be a Running Flat. Minute wave "a" of this sub structure topped at 2816.94 while the supposed Minute wave "c" only reached 2815.15. There are several reasons to treat the supposed Inverse Expanding Flat from October to March 2019 as a low probability wave count. Note closely the supposed Minute wave "v" of Minor wave "C" does not sub divide into five waves. The hourly chart of this structure also does not have a five-wave pattern. Daily RSI confirmed the rally high made on March 21 and US stocks are seasonally bullish until early May. |
|
| Figure 4. A case can be made that an Inverse Expanding Flat began after the October 11 short�term bottom and may have ended at the March 21 top. |
| Graphic provided by: BigCharts.com. |
| |
| Maintaining Objectivity When using Elliott wave theory, there's always an element of subjectivity; to stay on the right side of the market always understand for every bullish count there a bearish alternate. Another way to remain objective is to examine evidence from all four market dimensions: Price, Time, Sentiment and Momentum. Elliott wave is within the Price dimension; therefore, your primary wave count must be based upon the weight of evidence from the other three dimensions. So far in March the SPX has come within 80 points of making a new all-time high. Evidence from the dimensions of Time and Momentum favor the bull market continuing, however the possibility that an Inverse Expanding Flat could be complete at the March 21 high puts us on alert. If the SPX breaks below 2660 within the next few weeks something much more bearish could be developing. Be prepared, the greatest traders are the greatest opportunists. If a market suddenly changes direction you need to profit from that change. Further Reading: Frost A.J and Robert Prechter (1985) "Elliott Wave Principle", New Classics Library. |
Independent investment advisor, trader and writer. He has written articles for Technical Analysis of Stocks & Commodities, Traders.com Advantage,Futuresmag.com and, Finance Magnates. Author of website Four Dimension Trading.
| Website: | www.fourdimensiontrading.com |
| E-mail address: | markrivest@gmail.com |
Click here for more information about our publications!
Comments

Request Information From Our Sponsors
- StockCharts.com, Inc.
- Candle Patterns
- Candlestick Charting Explained
- Intermarket Technical Analysis
- John Murphy on Chart Analysis
- John Murphy's Chart Pattern Recognition
- John Murphy's Market Message
- MurphyExplainsMarketAnalysis-Intermarket Analysis
- MurphyExplainsMarketAnalysis-Visual Analysis
- StockCharts.com
- Technical Analysis of the Financial Markets
- The Visual Investor
- VectorVest, Inc.
- Executive Premier Workshop
- One-Day Options Course
- OptionsPro
- Retirement Income Workshop
- Sure-Fire Trading Systems (VectorVest, Inc.)
- Trading as a Business Workshop
- VectorVest 7 EOD
- VectorVest 7 RealTime/IntraDay
- VectorVest AutoTester
- VectorVest Educational Services
- VectorVest OnLine
- VectorVest Options Analyzer
- VectorVest ProGraphics v6.0
- VectorVest ProTrader 7
- VectorVest RealTime Derby Tool
- VectorVest Simulator
- VectorVest Variator
- VectorVest Watchdog