

HOT TOPICS LIST
- MACD
- Fibonacci
- RSI
- Gann
- ADXR
- Stochastics
- Volume
- Triangles
- Futures
- Cycles
- Volatility
- ZIGZAG
- MESA
- Retracement
- Aroon
INDICATORS LIST
LIST OF TOPICS
PRINT THIS ARTICLE
by Stella Osoba, CMT
The S&P declined by over 54 points on Friday March 22, 2019, and yet Tiffany & Co., (TIF) shares climbed, so what does this tell us about the stock?
Position: N/A
Stella Osoba, CMT
Stella Osoba is a trader and financial writer. She is a frequent contributor to "Technical Analysis of Stocks and Commodities" magazine and "Traders.com Advantage" as well as other financial publications.
PRINT THIS ARTICLE
TECHNICAL ANALYSIS
Actual Vs Consensus
03/27/19 06:10:49 PMby Stella Osoba, CMT
The S&P declined by over 54 points on Friday March 22, 2019, and yet Tiffany & Co., (TIF) shares climbed, so what does this tell us about the stock?
Position: N/A
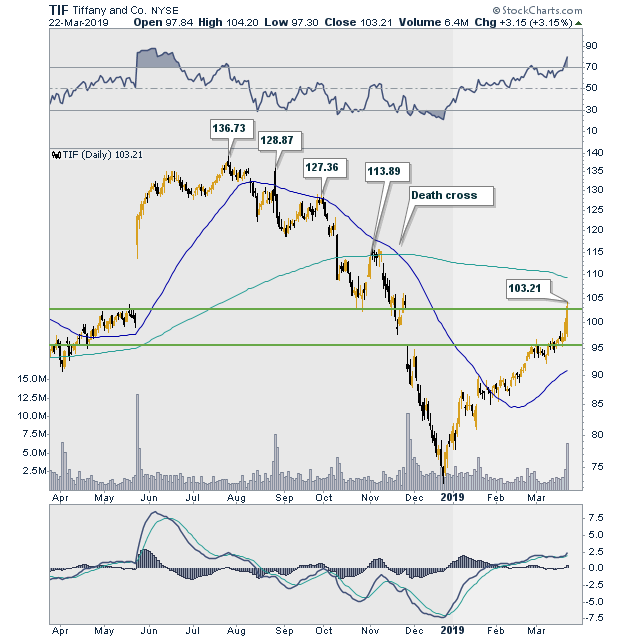
| On March 22, 2019, before market open, TIF reported 4th quarter 2018 earnings per share of $1.67, which was $0.06, or a smidgen, better than analysts estimate of $1.61. Despite the revenue miss for the quarter of $1.6 billion versus the consensus estimate of $1.34 billion, TIF shares rose $3.13 and closed the day at $103.21. The result of actual earnings versus consensus estimates on short term share prices are unpredictable at best. In this instance, the case can be made that earnings were not the cause of the improving technical picture of TIF. |
| Figure 1 is a daily chart of TIF showing the precipitous decline in the stock over the last nine months. The stock's highest close was on July 25, 2018, when it ended the trading day to close at 137.15. This was the beginning of its decline. TIF fell over the next several months, making lower highs and lower lows to close at a low of 73.79 on December 24, 2018. It might not have been evident then, but that was the low in the current trend. The stock proceeded to make a V shaped recovery. |
|
| Figure 1. Daily chart for TIF. |
| Graphic provided by: StockCharts.com. |
| |
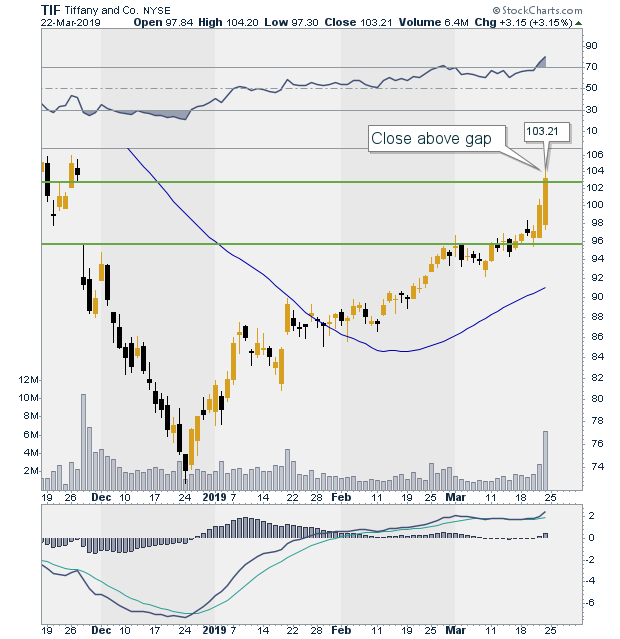
| So the stock was already well into its recovery when it notched its gains on March 22, 2019. Figure 2 shows a more detailed daily chart of price. We can see that TIF had broken above its 50-day moving average, which is also turning up. TIF found resistance at the area of a major prior gap made on November 28, 2018, which was the market's reaction to TIF's 3rd quarter earnings result. The result then was interpreted by the market as disappointing because it was merely in line with consensus estimates. In that instance TIF was already in a downtrend, and the reaction to earnings was simply to continue the prevailing trend. |
|
| Figure 2. Recent price action on the TIF daily chart. |
| Graphic provided by: StockCharts.com. |
| |
| Stocks act each in their own peculiar way and it is useful to get to know the particular stocks you trade and their individual behaviors. While earnings surprises can cause some stocks to gap up or down against the trend, this is not always the case, and some stocks will show behavior that is in line with their prevailing trend, even when the earnings results are not spectacular. |
Stella Osoba is a trader and financial writer. She is a frequent contributor to "Technical Analysis of Stocks and Commodities" magazine and "Traders.com Advantage" as well as other financial publications.
| E-mail address: | stellaosoba@gmail.com |
Click here for more information about our publications!
PRINT THIS ARTICLE

Request Information From Our Sponsors
- StockCharts.com, Inc.
- Candle Patterns
- Candlestick Charting Explained
- Intermarket Technical Analysis
- John Murphy on Chart Analysis
- John Murphy's Chart Pattern Recognition
- John Murphy's Market Message
- MurphyExplainsMarketAnalysis-Intermarket Analysis
- MurphyExplainsMarketAnalysis-Visual Analysis
- StockCharts.com
- Technical Analysis of the Financial Markets
- The Visual Investor
- VectorVest, Inc.
- Executive Premier Workshop
- One-Day Options Course
- OptionsPro
- Retirement Income Workshop
- Sure-Fire Trading Systems (VectorVest, Inc.)
- Trading as a Business Workshop
- VectorVest 7 EOD
- VectorVest 7 RealTime/IntraDay
- VectorVest AutoTester
- VectorVest Educational Services
- VectorVest OnLine
- VectorVest Options Analyzer
- VectorVest ProGraphics v6.0
- VectorVest ProTrader 7
- VectorVest RealTime Derby Tool
- VectorVest Simulator
- VectorVest Variator
- VectorVest Watchdog