HOT TOPICS LIST
- MACD
- Fibonacci
- RSI
- Gann
- ADXR
- Stochastics
- Volume
- Triangles
- Futures
- Cycles
- Volatility
- ZIGZAG
- MESA
- Retracement
- Aroon
INDICATORS LIST
LIST OF TOPICS
PRINT THIS ARTICLE
by Mark Rivest
Techniques to discover trend changes.
Position: N/A
Mark Rivest
Independent investment advisor, trader and writer. He has written articles for Technical Analysis of Stocks & Commodities, Traders.com Advantage,Futuresmag.com and, Finance Magnates. Author of website Four Dimension Trading.
PRINT THIS ARTICLE
VOLATILITY
Using The CBOE Volatility Index In Bull And Bear Markets
03/21/19 04:34:56 PMby Mark Rivest
Techniques to discover trend changes.
Position: N/A
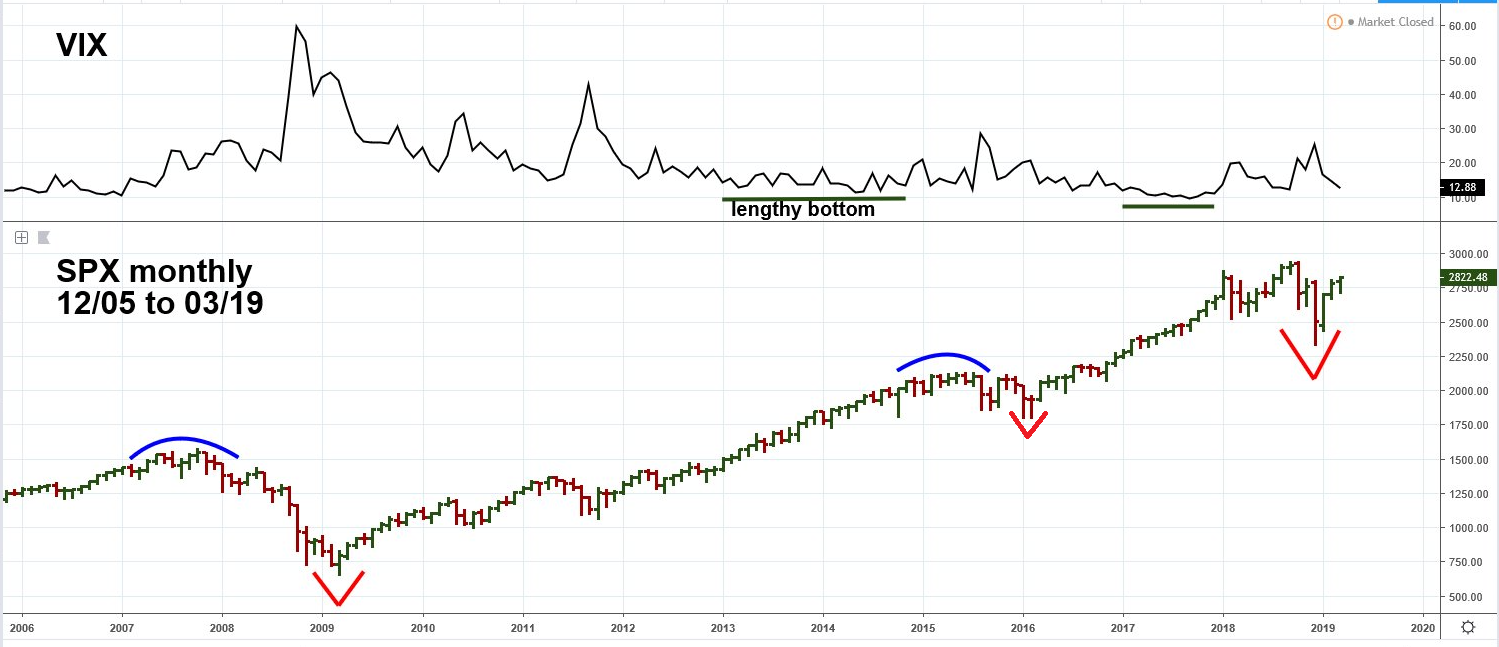
| The CBOE Volatility Index, (VIX) is a popular measure of the stock market's expectation of volatility implied by S&P 500 (SPX) index options. It's calculated by the Chicago Board Options Exchange (CBOE), and is commonly referred to as the fear index. The VIX can be a useful tool in discovering stock market bottoms, it's not so effective in discovering tops. Stock Market Tops And Bottoms All markets move between fear/pessimism and hope/optimism. Fear is intense, hope is diffused — in stock markets this usually creates sharp bottoms and spread out tops. Major stock indices typically bottom on the same day, while tops are separated by days, weeks, and sometimes months. Please see the monthly VIX and SPX chart illustrated in Figure 1. In July 2007 the Russell 2000 made its high, the SPX topped in October and the Dow Jones Utility Average peaked in January 2008. All three indices bottomed in March 2009. The SPX topping process during 2015 was in a narrow range, hitting its high in May, The Russell 2000 and the Nasdaq Composite topped in July. All three indices hit their lows in February 2016. Because of the shallowness of the 2015 to 2016 decline some indices bottomed before February 2016. The 2018 peak only covered two months with the Nasdaq Composite high on August 30th, the SPX on September 21st and the Dow Jones industrial Average on October 3rd. The SPX and Dow industrial made lows on December 26th, the Nasdaq Composite bottomed on December 24. Finally, note the long VIX bottoming process from 2013 to 2014 and again in 2017. Just because the VIX is making a new low does not mean the SPX is making a significant top. |

|
| Figure 1. The SPX topping process during 2015 was in a narrow range, hitting its high in May. |
| Graphic provided by: tradingview.com. |
| |
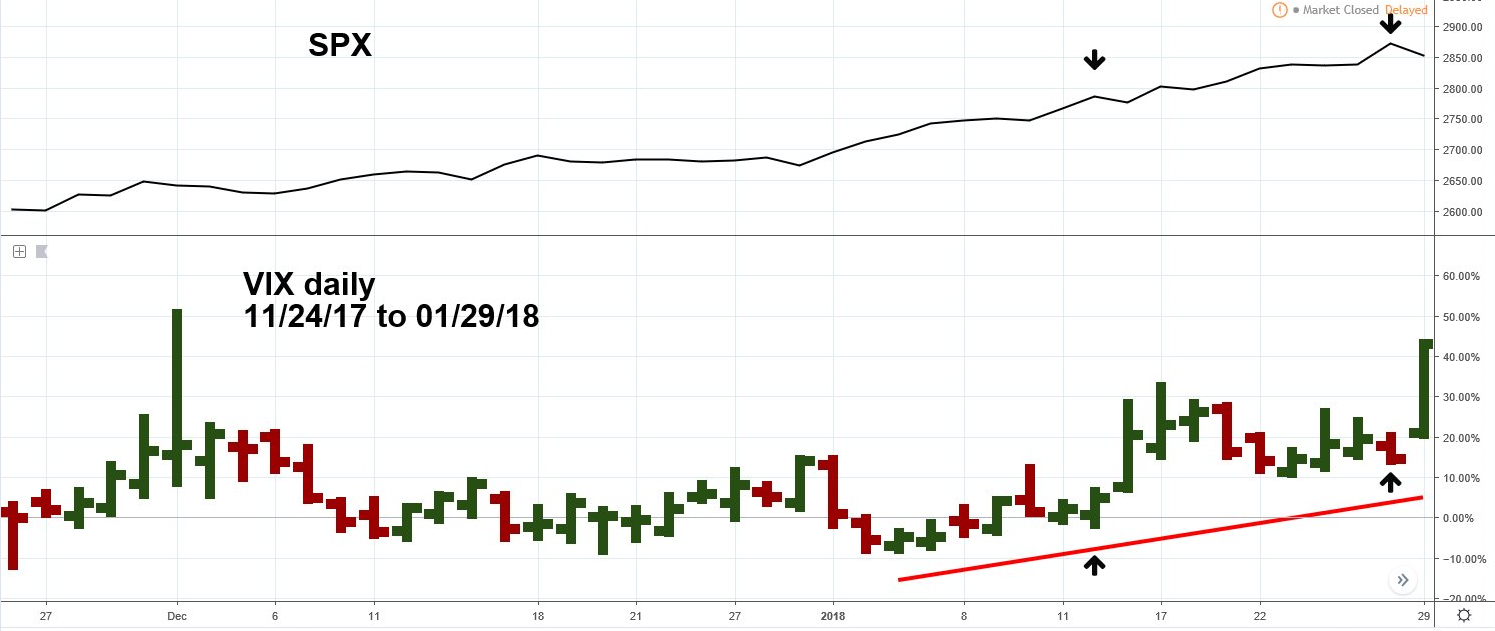
| Using the VIX to Find Tops The VIX is very good at discovering when the SPX could be bottoming because it usually has sharp spikes up as the SPX is making a low. However, the VIX can hover near the bottom of its range for several months while the SPX makes new high. Please see the daily VIX and SPX chart illustrated in Figure 2. Typically, when the SPX is nearing a significant peak the VIX will rise, putting in a series of short -term rising bottoms as the SPX makes new highs. This is what happened in early 2018 when the SPX had a dynamic thrust up. The reason for this phenomenon is that the VIX is options based and traders are increasing Put purchases in anticipation of a down turn. The problem with using a rising VIX to catch a top is you don't know how many rising bottoms are needed before the SPX registers its final high. It's better to use other technical indicators to catch an SPX top and use the rising VIX as an early warning signal. |

|
| Figure 2. Typically, when the SPX is nearing a significant peak the VIX will rise. |
| Graphic provided by: tradingview.com. |
| |
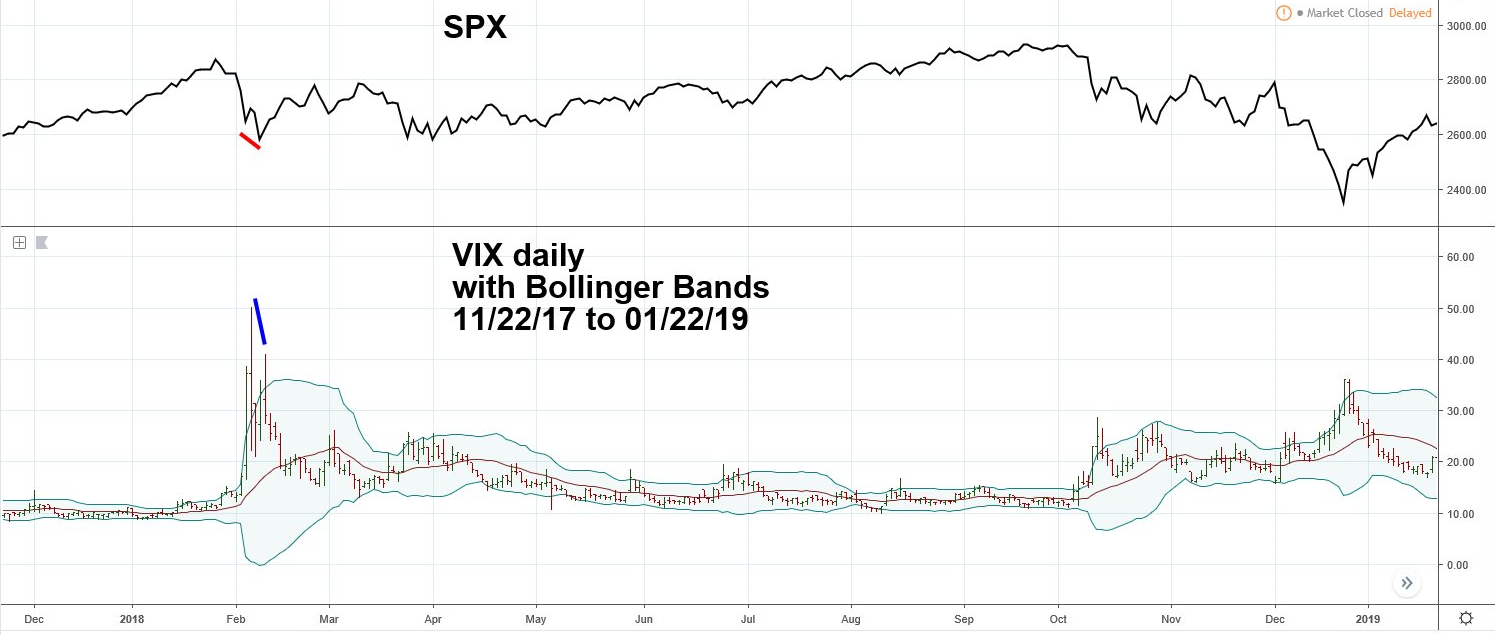
| Using the VIX to Find Bottoms As the SPX makes a bottom the VIX will spike up, the bigger the spike the more likely a bottom is in place or could be soon. Please see the daily VIX with Bollinger Bands chart illustrated in Figure 3. Using Bollinger Bands in conjunction with VIX is a great way to discover spikes. Note the powerful spike way above the upper Bollinger Band registered in early February 2018. This caught a short-term bottom, then the SPX made a lower bottom with a lower VIX spike. This phenomenon is a clear sign fear is lessening and implies a SPX bottom that could hold for several months. The late 2018 SPX bottom had only one VIX top, however note that the VIX was above the upper Bollinger Band for four consecutive trading days. Usually if the VIX is above the upper band for two or more consecutive days it is a signal a bottom is near or already in place. |

|
| Figure 3. Using Bollinger Bands in conjunction with VIX is a great way to discover spikes. |
| Graphic provided by: tradingview.com. |
| |
| VIX March 2019 At the late December 2018 SPX bottom the VIX reached 36.20, on March 15 the SPX closed at a rally high of 2822, the VIX was 12.90. If the rally continues there are two important VIX levels to watch. The first is 10.17, made in August 2018 just before the SPX final move to an all-time high. The other is the VIX multi-year low of 8.56 made in November 2017 prior to the SPX dynamic push into the January 2018 top. Moves below either of these levels could be bullish with the rally continuing at least one to two months. If the SPX makes a new all-time high and is accompanied by a rising VIX it's a yellow caution flag for a potentially significant stock market top. Further Reading: Rivest, Mark {2019} "The US Long Wave Revisited" Technical Analysis of Stocks & Commodities, Volume 37: Bonus Issue. |
Independent investment advisor, trader and writer. He has written articles for Technical Analysis of Stocks & Commodities, Traders.com Advantage,Futuresmag.com and, Finance Magnates. Author of website Four Dimension Trading.
| Website: | www.fourdimensiontrading.com |
| E-mail address: | markrivest@gmail.com |
Click here for more information about our publications!
PRINT THIS ARTICLE

Request Information From Our Sponsors
- VectorVest, Inc.
- Executive Premier Workshop
- One-Day Options Course
- OptionsPro
- Retirement Income Workshop
- Sure-Fire Trading Systems (VectorVest, Inc.)
- Trading as a Business Workshop
- VectorVest 7 EOD
- VectorVest 7 RealTime/IntraDay
- VectorVest AutoTester
- VectorVest Educational Services
- VectorVest OnLine
- VectorVest Options Analyzer
- VectorVest ProGraphics v6.0
- VectorVest ProTrader 7
- VectorVest RealTime Derby Tool
- VectorVest Simulator
- VectorVest Variator
- VectorVest Watchdog
- StockCharts.com, Inc.
- Candle Patterns
- Candlestick Charting Explained
- Intermarket Technical Analysis
- John Murphy on Chart Analysis
- John Murphy's Chart Pattern Recognition
- John Murphy's Market Message
- MurphyExplainsMarketAnalysis-Intermarket Analysis
- MurphyExplainsMarketAnalysis-Visual Analysis
- StockCharts.com
- Technical Analysis of the Financial Markets
- The Visual Investor
