HOT TOPICS LIST
- MACD
- Fibonacci
- RSI
- Gann
- ADXR
- Stochastics
- Volume
- Triangles
- Futures
- Cycles
- Volatility
- ZIGZAG
- MESA
- Retracement
- Aroon
INDICATORS LIST
LIST OF TOPICS
PRINT THIS ARTICLE
by Stella Osoba, CMT
Nike, Inc (NKE) makes up about two thirds of Foot Locker's (FL) purchases, therefore it would make sense if the stocks of these two companies moved in lockstep. So, is this the case?
Position: N/A
Stella Osoba, CMT
Stella Osoba is a trader and financial writer. She is a frequent contributor to "Technical Analysis of Stocks and Commodities" magazine and "Traders.com Advantage" as well as other financial publications.
PRINT THIS ARTICLE
TECHNICAL ANALYSIS
Do Nike and Footlocker Move in Lockstep?
03/21/19 04:06:27 PMby Stella Osoba, CMT
Nike, Inc (NKE) makes up about two thirds of Foot Locker's (FL) purchases, therefore it would make sense if the stocks of these two companies moved in lockstep. So, is this the case?
Position: N/A
| NKE is a large cap consumer discretionary company. It is the largest seller of athletic footwear and apparel in the world. Its business is in the design, development, marketing and selling of athletic footwear, and other apparel, accessories and services. FL is a mid cap consumer discretionary company. Its business is the sale of athletically inspired shoes and apparel. As of February 3, 2018, FL operated 3,310 stores in high traffic urban retail areas globally. They purchased most of their merchandise from 5 main suppliers. The largest of these was NKE. Approximately 67 percent of all merchandise purchased by FL in 2017 was purchased from NKE. FL has five operating divisions which are all highly dependent on products purchased from NKE. According to company reports, in 2017 these divisions individually purchased between 44 and 73 percent of their merchandise from NKE. |
| FL states in its annual report that "because of the high proportion of purchases from Nike, any adverse development in Nike's reputation, financial condition or results of operations or the inability of Nike to develop and manufacture products that appeal to our target customers could also have an adverse effect on [their] business, financial condition, and results of operations. [They] cannot be certain that [they] will be able to acquire merchandise at competitive prices or on competitive terms in the future. These risks could have a material adverse effect on [their] business, financial condition, and results of operations". |

|
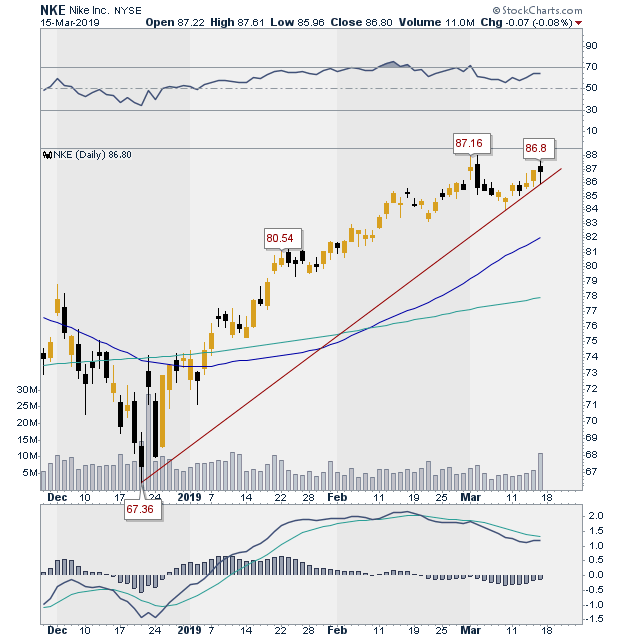
| Figure 1. Daily chart for NKE. |
| Graphic provided by: StockCharts.com. |
| |
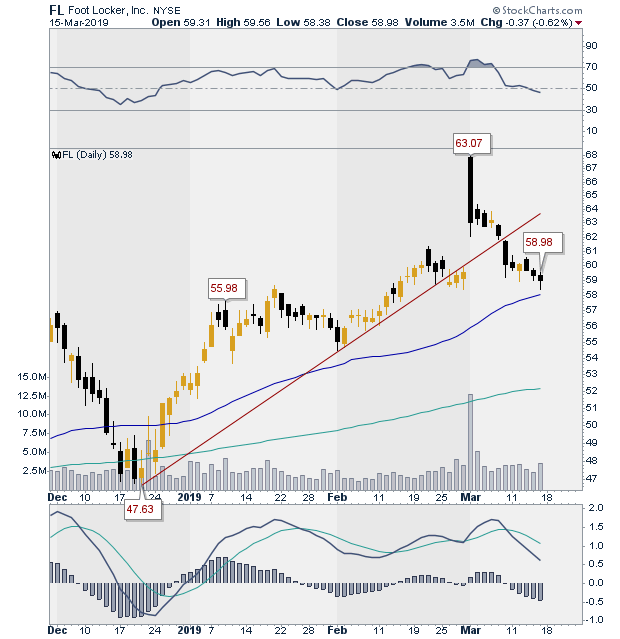
| Because of the reliance FL has on NKE, it would therefore make sense if the share price of the two companies moved in lockstep, so what do the charts show? Figure 1 shows a chart of NKE. It is in an uptrend as the unbroken trend line clearly shows. The 50-day moving average is trending up, having crossed over the longer moving average. Figure 2, which shows FL's price action, shows a more volatile stock. Price has broken below its up trend line and is sitting on its 50-day moving average. The shorter, or 50-day moving average, is still above the longer 200-day moving average which is a positive. |

|
| Figure 2. Daily chart for FL. |
| Graphic provided by: StockCharts.com. |
| |
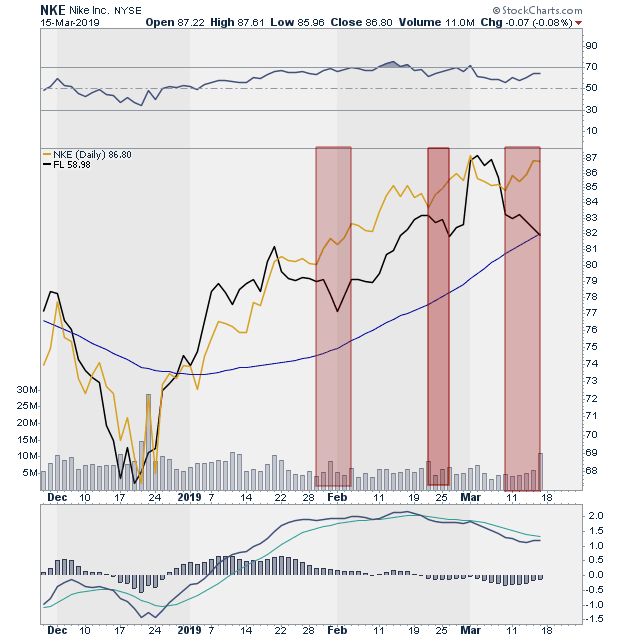
| Figure 3 is a line chart of the two securities to allow for easier comparison. We can see that in general the two stocks do appear to move together, but there are significant periods of diversion which are highlighted in the red boxes superimposed on the chart. These periods are times when NKE is moving up, but FL is moving downwards. Notwithstanding these divergent periods which are rather limited in time, it seems that for the bulk of the period, as shown on the chart, the two securities move similarly. It is interesting to note that current price action shows a significant price diversion between the two securities. FL locker has made a significant downward move and is testing its moving average. NKE is still moving up but it is testing its prior price high. |

|
| Figure 3. Line charts for NKE and FL with diversion areas highlighted in red boxes. |
| Graphic provided by: StockCharts.com. |
| |
| One point to bear in mind is that even though FL is highly dependent on merchandise from NKE, the reverse is not true. NKE states in its annual report that it has several large customers, but that no one customer accounted for 10% or more of their worldwide net revenues in 2018. Therefore the ability of FL's performance to drag down the performance of NKE has to be limited, while the opposite is not likely to be the case. |
Stella Osoba is a trader and financial writer. She is a frequent contributor to "Technical Analysis of Stocks and Commodities" magazine and "Traders.com Advantage" as well as other financial publications.
| E-mail address: | stellaosoba@gmail.com |
Click here for more information about our publications!
Comments

Request Information From Our Sponsors
- StockCharts.com, Inc.
- Candle Patterns
- Candlestick Charting Explained
- Intermarket Technical Analysis
- John Murphy on Chart Analysis
- John Murphy's Chart Pattern Recognition
- John Murphy's Market Message
- MurphyExplainsMarketAnalysis-Intermarket Analysis
- MurphyExplainsMarketAnalysis-Visual Analysis
- StockCharts.com
- Technical Analysis of the Financial Markets
- The Visual Investor
- VectorVest, Inc.
- Executive Premier Workshop
- One-Day Options Course
- OptionsPro
- Retirement Income Workshop
- Sure-Fire Trading Systems (VectorVest, Inc.)
- Trading as a Business Workshop
- VectorVest 7 EOD
- VectorVest 7 RealTime/IntraDay
- VectorVest AutoTester
- VectorVest Educational Services
- VectorVest OnLine
- VectorVest Options Analyzer
- VectorVest ProGraphics v6.0
- VectorVest ProTrader 7
- VectorVest RealTime Derby Tool
- VectorVest Simulator
- VectorVest Variator
- VectorVest Watchdog
