

HOT TOPICS LIST
- MACD
- Fibonacci
- RSI
- Gann
- ADXR
- Stochastics
- Volume
- Triangles
- Futures
- Cycles
- Volatility
- ZIGZAG
- MESA
- Retracement
- Aroon
INDICATORS LIST
LIST OF TOPICS
PRINT THIS ARTICLE
by Taylor Ireland
In this article, we examine the order flow and limit order book data in the WTI futures market that provides insight into the development of support for Thursday, March 7, 2019. Market structure and order flow provide insight into the actual transactional activity of a dual-auction's price discovery process. Analysis of this data provides real-time insight into the actions of market participants, providing a dynamic dataset to inform one's risk management process.
Position: N/A
Taylor Ireland
Sharedata Futures, Inc. provides historical data mining and visualization for the benchmark NYMEX Energy Futures Markets.
Sharedata combines structural analysis of the market generated data, dynamic systems analysis, and Bayesian causal inference techniques favored by the scientific and intelligence communities to provide a robust framework for addressing the uncertainty and risk in energy pricing.
PRINT THIS ARTICLE
DAY TRADING
Anatomy Of A Low: Order Flow And Order Book Data Provide Insight
03/14/19 03:46:44 PMby Taylor Ireland
In this article, we examine the order flow and limit order book data in the WTI futures market that provides insight into the development of support for Thursday, March 7, 2019. Market structure and order flow provide insight into the actual transactional activity of a dual-auction's price discovery process. Analysis of this data provides real-time insight into the actions of market participants, providing a dynamic dataset to inform one's risk management process.
Position: N/A
| The Thursday, March 7 auction saw Globex price discovery higher within the context of developing balance, 55.42s-57.19s, in the weekly context. The market auctioned toward key resistance, 57s, ahead of the NY open where the buy-side phase was halted. Once the daily high was established and the sell-side sequence begun, the near-term concern for market participants is where might the sell-side auction halt, either offering profit location for short positioning from above or a long entry for potential further upside activity. |
| This question is better analyzed with the use of order flow and limit order book (LOB) analysis. In short, plotting the buy and sell transactions of significance (in this case volume equal to or greater than 150 contracts) as well as the resting limit bids and offers (equal to or greater than 50 contracts) allows us to see both the actions and intent of larger participants (those who actually drive price). |
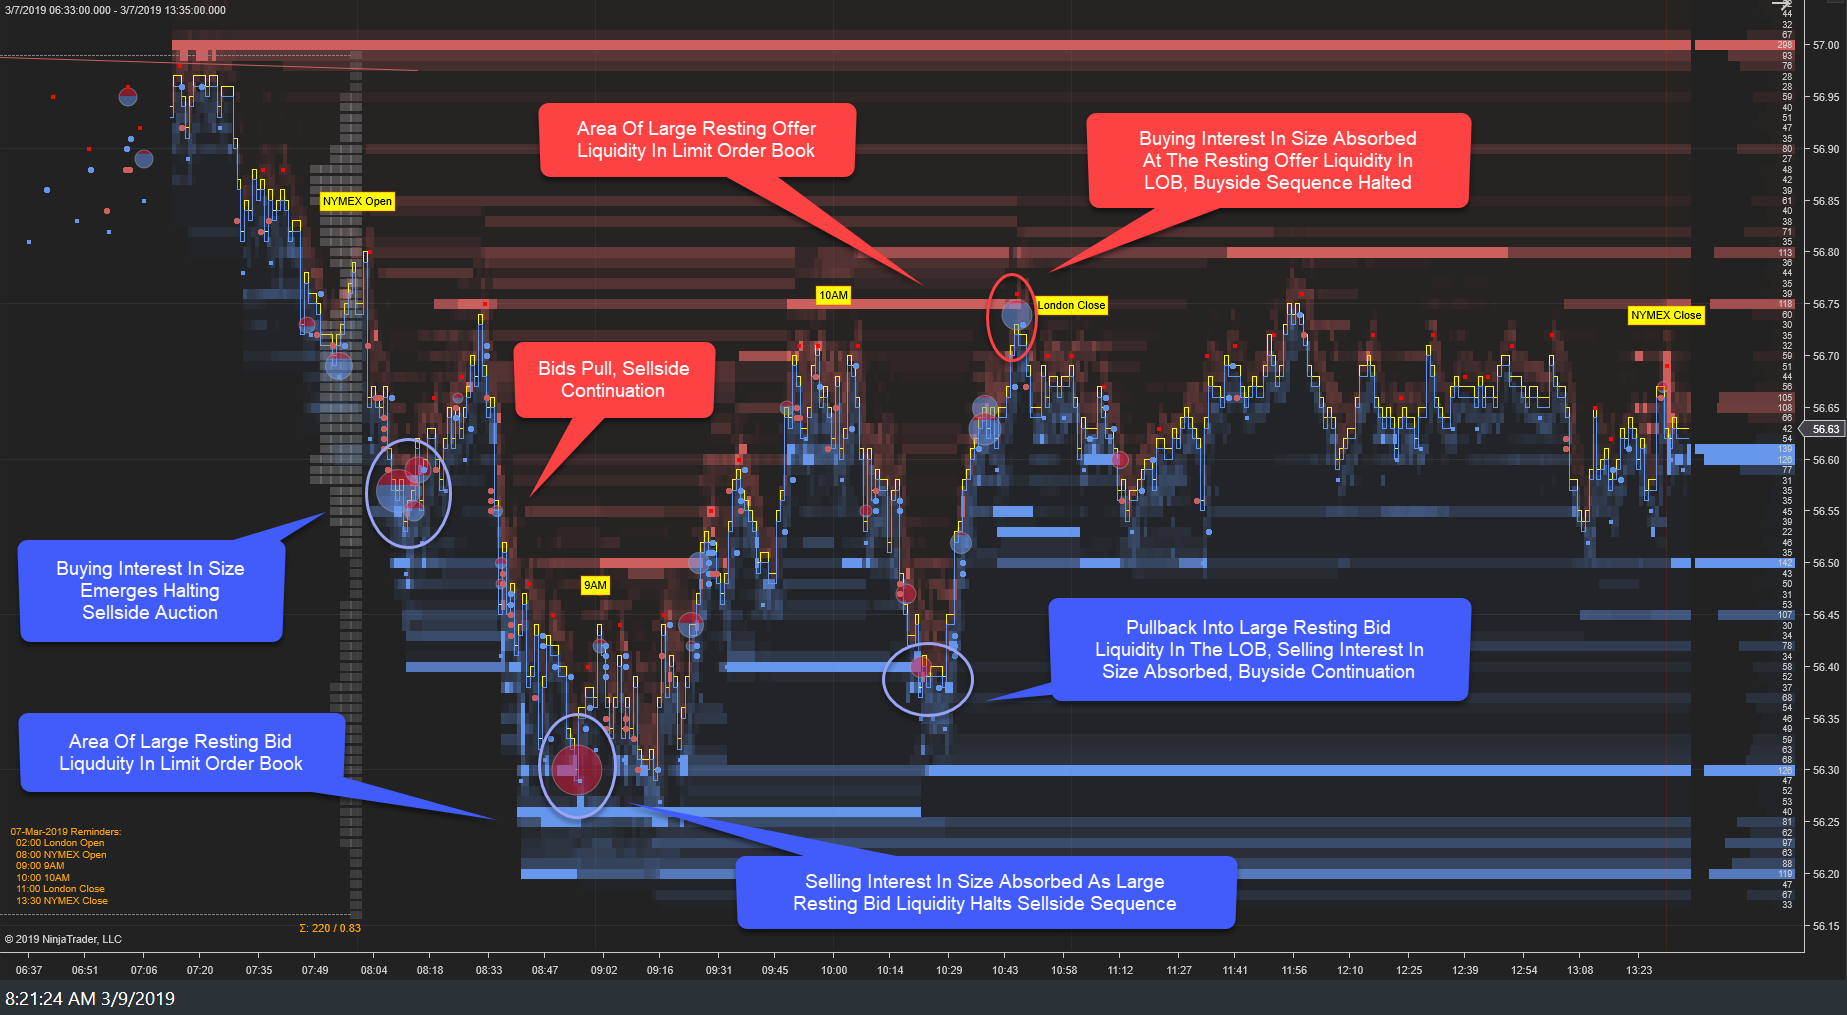
| In Figure 1, following the commencement of the sell-side auction we see buying interest in size emerge following the NY open at/near 56.55s-56.60s. This temporarily halts the sell-side sequence. Upon the pullback, there is no bid liquidity nor buying interest in size. This circumstance brings about sell-side continuation within the price discovery process. The market auctions toward 56.30s. Here we see a confluence of events. The limit order book reflects large resting bid liquidity (intent) between 56.30s-56.25s. These buyers are willing to absorb aggressive sell-side order flow. Additionally, we see sellers in size hit the bid aggressively at 56.30s. This is the actual behavior of participants in large quantity. The selling effort fails to drive price lower as the bid liquidity absorbs the supply. This results in a shift in the order flow sequence of the market to buy-side. |
|
| Figure 1. WTI Futures on March 7, 2019. (Right-click chart and view in a new window for a larger view) |
| Graphic provided by: NinjaTrader. |
| |
| Following the development of the low, the market trades higher initially before a pullback manifests at/near 56.40s-56.35s. Again, the market generated data reveals large resting bid liquidity in the LOB as sellers in size again attempt to drive price lower to 56.40s. Again, the supply is absorbed, and the result is forced adjustment of inventory by the sell-side higher toward 56.75s. This time, the buyers in size trap at/near 56.75s as large resting offer liquidity absorbs the demand, shutting off the buy-side sequence into the London close period. |
| The order flow and limit order book data provided qualitative insight into the difference between the initial stopping point low, 56.55s, shortly after the NY open and the actual low, 56.25s, that developed later. This structural development provided indication and warning of a potential shift of trend based not on lagging price indicators but the transactional behavior and intent of significant quantity to drive price discovery. |
Sharedata Futures, Inc. provides historical data mining and visualization for the benchmark NYMEX Energy Futures Markets.
Sharedata combines structural analysis of the market generated data, dynamic systems analysis, and Bayesian causal inference techniques favored by the scientific and intelligence communities to provide a robust framework for addressing the uncertainty and risk in energy pricing.
| Title: | Founder |
| Company: | Sharedata Futures, Inc. |
| Dallas, TX | |
| Website: | www.sdfanalytics.com |
| E-mail address: | support@sdfanalytics.com |
Traders' Resource Links | |
| Sharedata Futures, Inc. has not added any product or service information to TRADERS' RESOURCE. | |
Click here for more information about our publications!
PRINT THIS ARTICLE

Request Information From Our Sponsors
- VectorVest, Inc.
- Executive Premier Workshop
- One-Day Options Course
- OptionsPro
- Retirement Income Workshop
- Sure-Fire Trading Systems (VectorVest, Inc.)
- Trading as a Business Workshop
- VectorVest 7 EOD
- VectorVest 7 RealTime/IntraDay
- VectorVest AutoTester
- VectorVest Educational Services
- VectorVest OnLine
- VectorVest Options Analyzer
- VectorVest ProGraphics v6.0
- VectorVest ProTrader 7
- VectorVest RealTime Derby Tool
- VectorVest Simulator
- VectorVest Variator
- VectorVest Watchdog
- StockCharts.com, Inc.
- Candle Patterns
- Candlestick Charting Explained
- Intermarket Technical Analysis
- John Murphy on Chart Analysis
- John Murphy's Chart Pattern Recognition
- John Murphy's Market Message
- MurphyExplainsMarketAnalysis-Intermarket Analysis
- MurphyExplainsMarketAnalysis-Visual Analysis
- StockCharts.com
- Technical Analysis of the Financial Markets
- The Visual Investor