

HOT TOPICS LIST
- MACD
- Fibonacci
- RSI
- Gann
- ADXR
- Stochastics
- Volume
- Triangles
- Futures
- Cycles
- Volatility
- ZIGZAG
- MESA
- Retracement
- Aroon
INDICATORS LIST
LIST OF TOPICS
PRINT THIS ARTICLE
by Fawad Razaqzada
Examining Fibonacci levels and confirming technical tools.
Position: N/A
Fawad Razaqzada
Fawad Razaqzada is an experienced analyst and economist having been involved in the financial markets since 2010 working for leading global FX and CFD brokerages. Having graduated with a degree in economics and leveraging years of financial market experience, Fawad provides retail and professional traders worldwide with succinct fundamental & technical analysis. In addition, he also offers premium trade signals to subscribers, and trading education to help shorten the learning curves of developing traders. He has also been trading on his personal account for many years. Follow Fawad on twitter @Trader_F_R or visit his website at TradingCandles.com.
PRINT THIS ARTICLE
FIBONACCI
Fibonacci Confluence With Other Tools Provide Better Trading Signals
03/07/19 04:48:31 PMby Fawad Razaqzada
Examining Fibonacci levels and confirming technical tools.
Position: N/A
| Like anything else, Fibonacci levels are best used in conjunction with other technical tools. When there is a confluence of technical factors converging around a price level, it becomes likely that more technical market participants would notice such levels and therefore act on them by buying or selling around those levels. For example, a Fibonacci retracement level that happens to be near a round psychologically-important figure such as $100 in the case of an individual stock or, say, $1.2000 in foreign exchange, price will more likely than not react from such a level, providing at least a tradable bounce. If more technical tools converge, such as the 200-day moving average or a prior broken support or resistance level, then that makes it even more interesting. |
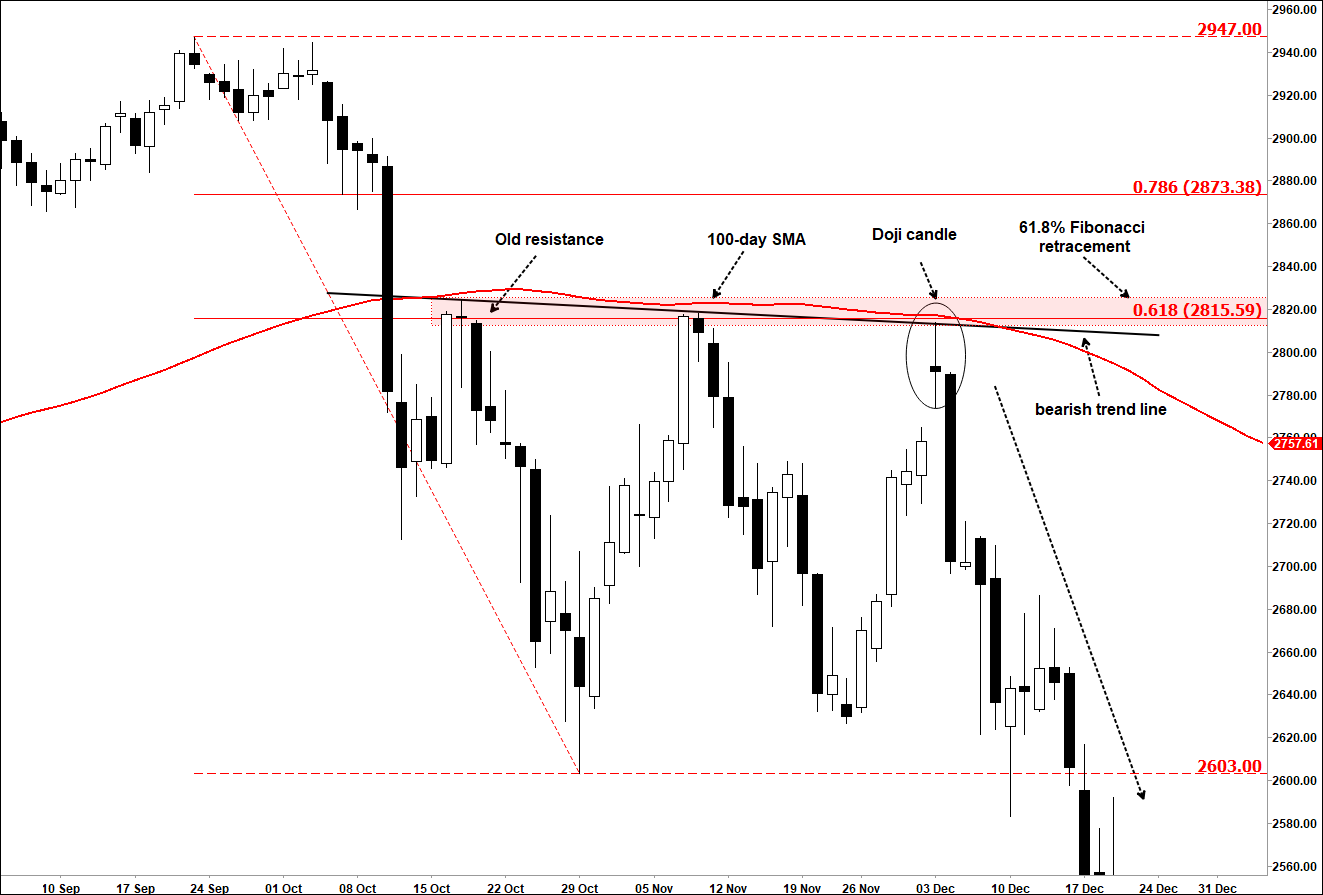
| In the example below, Figure 1, we can see that the S&P 500 E-Mini Futures twice rebounded to test the 61.8% Fibonacci retracement against its most recent high, at around 2815, at the back end of last year. In addition to the Fibonacci level, it was met with prior resistance, a bearish trend line and the 100-day moving average, all converging in close proximity to one another. The first test of this resistance area in November led to a sizeable pullback, which could have been traded. But the second test of this resistance zone in December led to an even larger drop that eventually saw the low at 2603 break down. In the second test, the index went on to form a bearish-looking doji daily candlestick pattern, providing confirmation that resistance was indeed strong there. Thus, even if the initial sell at the 61.8% Fibonacci level was not taken, traders could have sold once the index broke below the low of the doji candle that was created on the second re-test of that resistance area. In this example, the stop loss order could have been a relatively tight one, just above the high of that signal doji candle, while the target could have been the liquidity pool below the 2603 level, where sell stop orders would have been resting from those who had bought the dip. |
|
| Figure 1: S&P 500 E-Mini Futures. |
| Graphic provided by: eSignal. |
| |
| As experience grows, traders can become progressively more subjective in their trading decisions. They can still use technical tools that provide objective decision-making, such as moving averages and Fibonacci levels. But as far as newer and developing traders are concerned, they should stick to objective entry and exit techniques and incorporate as many such technical tools in their trading decisions as possible, although not too many to cause analysis paralysis. Perhaps they should limit subjectivity only in the trade selection process, rather than in their trading edge. So, if they find two similar setups that tick most of the check boxes in their strategy, then they can use their discretion to select the best one. |
Fawad Razaqzada is an experienced analyst and economist having been involved in the financial markets since 2010 working for leading global FX and CFD brokerages. Having graduated with a degree in economics and leveraging years of financial market experience, Fawad provides retail and professional traders worldwide with succinct fundamental & technical analysis. In addition, he also offers premium trade signals to subscribers, and trading education to help shorten the learning curves of developing traders. He has also been trading on his personal account for many years. Follow Fawad on twitter @Trader_F_R or visit his website at TradingCandles.com.
| Title: | Financial Market Analyst |
| Company: | TradingCandles.com |
| London, | |
| Website: | tradingcandles.com |
| E-mail address: | fawad.razaqzada@hotmail.co.uk |
Traders' Resource Links | |
| TradingCandles.com has not added any product or service information to TRADERS' RESOURCE. | |
Click here for more information about our publications!
PRINT THIS ARTICLE

Request Information From Our Sponsors
- StockCharts.com, Inc.
- Candle Patterns
- Candlestick Charting Explained
- Intermarket Technical Analysis
- John Murphy on Chart Analysis
- John Murphy's Chart Pattern Recognition
- John Murphy's Market Message
- MurphyExplainsMarketAnalysis-Intermarket Analysis
- MurphyExplainsMarketAnalysis-Visual Analysis
- StockCharts.com
- Technical Analysis of the Financial Markets
- The Visual Investor
- VectorVest, Inc.
- Executive Premier Workshop
- One-Day Options Course
- OptionsPro
- Retirement Income Workshop
- Sure-Fire Trading Systems (VectorVest, Inc.)
- Trading as a Business Workshop
- VectorVest 7 EOD
- VectorVest 7 RealTime/IntraDay
- VectorVest AutoTester
- VectorVest Educational Services
- VectorVest OnLine
- VectorVest Options Analyzer
- VectorVest ProGraphics v6.0
- VectorVest ProTrader 7
- VectorVest RealTime Derby Tool
- VectorVest Simulator
- VectorVest Variator
- VectorVest Watchdog