HOT TOPICS LIST
- MACD
- Fibonacci
- RSI
- Gann
- ADXR
- Stochastics
- Volume
- Triangles
- Futures
- Cycles
- Volatility
- ZIGZAG
- MESA
- Retracement
- Aroon
INDICATORS LIST
LIST OF TOPICS
PRINT THIS ARTICLE
by Stella Osoba, CMT
ServiceNow (NOW) has recently been notching impressive gains in its share price with its recent quarterly earnings surprise. What do the technicals say about the current trend continuing?
Position: N/A
Stella Osoba, CMT
Stella Osoba is a trader and financial writer. She is a frequent contributor to "Technical Analysis of Stocks and Commodities" magazine and "Traders.com Advantage" as well as other financial publications.
PRINT THIS ARTICLE
TECHNICAL ANALYSIS
Taking A Look At NOW
02/21/19 04:16:21 PMby Stella Osoba, CMT
ServiceNow (NOW) has recently been notching impressive gains in its share price with its recent quarterly earnings surprise. What do the technicals say about the current trend continuing?
Position: N/A
| NOW is an American cloud computing company. Cloud computing is the delivery of computing services such as databases, networking, software, servers and more over the internet. It is a big shift from the traditional way businesses use IT resources, in that businesses can reduce costs by outsourcing many of the functions that used to be done in house like buying hardware, running data-centers, etc. With a market capitalization of $41 billion, NOW is a large cap growth company. After announcing quarterly earnings on January 30, 2019 after market close, its stock gapped up because its revenue and earnings numbers beat analysts estimates. So with NOW notching new highs in its stock price, is this a continuation of a strong uptrend after a period of consolidation? |
| Figure 1 is a weekly chart of NOW showing its long term trend. The chart shows that since February 8, 2016, when its price closed at a weekly low of 50.08, it has been in an uptrend. The stock has risen in an almost perfect straight line as the trend line in ?Figure 1 shows. Price first broke its uptrend line in the week of October 8, 2018. After that, it trended sideways showing some volatile trading. The bounces and dips of price over the next few months caused price to form three lows. I will not call this a triple low price pattern nor an inverse head and shoulders because both patterns usually form after a downtrend, and NOW was clearly not in a downtrend but more of a consolidation, or sideways, move before these patterns formed. |

|
| Figure 1. Weekly chart for NOW. |
| Graphic provided by: StockCharts.com. |
| |
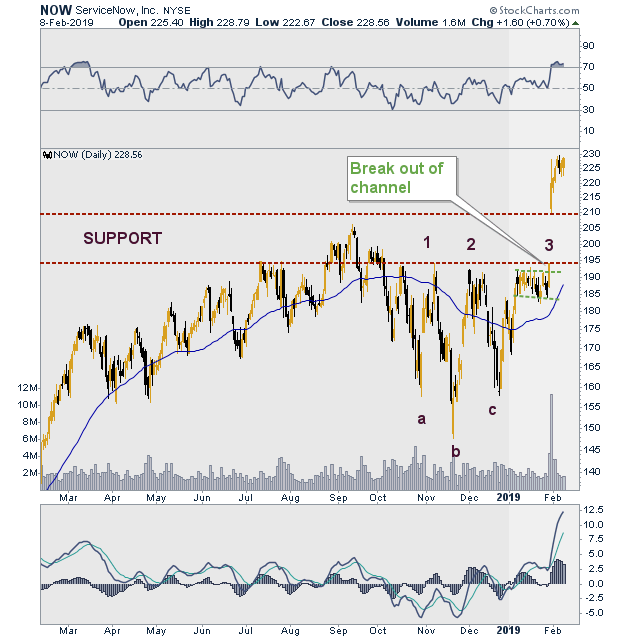
| Nevertheless, the price pattern was useful in helping to read the possible future direction of price. If this had been an inverse head and shoulders pattern, a line connecting points 1 and 2 on the chart would have formed a neckline. When the neckline is broken the pattern is valid. Figure 2 shows the three lows labeled A, B and C. A narrow channel formed after the completion of the three lows. The breakout from the channel at 3 on the chart portended well for price. This was valid confirmation for a bullish entry. |

|
| Figure 2. Daily chart for NOW. |
| Graphic provided by: StockCharts.com. |
| |
| The huge gap up came the next day after the earnings and revenue surprise was announced. Price has since posted higher highs, which continues to portend well for the stock. The whole area of the gap now becomes support. A break below the low of the support area closes the gap and is bearish. |
Stella Osoba is a trader and financial writer. She is a frequent contributor to "Technical Analysis of Stocks and Commodities" magazine and "Traders.com Advantage" as well as other financial publications.
| E-mail address: | stellaosoba@gmail.com |
Click here for more information about our publications!
Comments
Date: 02/22/19Rank: 4Comment:

Request Information From Our Sponsors
- StockCharts.com, Inc.
- Candle Patterns
- Candlestick Charting Explained
- Intermarket Technical Analysis
- John Murphy on Chart Analysis
- John Murphy's Chart Pattern Recognition
- John Murphy's Market Message
- MurphyExplainsMarketAnalysis-Intermarket Analysis
- MurphyExplainsMarketAnalysis-Visual Analysis
- StockCharts.com
- Technical Analysis of the Financial Markets
- The Visual Investor
- VectorVest, Inc.
- Executive Premier Workshop
- One-Day Options Course
- OptionsPro
- Retirement Income Workshop
- Sure-Fire Trading Systems (VectorVest, Inc.)
- Trading as a Business Workshop
- VectorVest 7 EOD
- VectorVest 7 RealTime/IntraDay
- VectorVest AutoTester
- VectorVest Educational Services
- VectorVest OnLine
- VectorVest Options Analyzer
- VectorVest ProGraphics v6.0
- VectorVest ProTrader 7
- VectorVest RealTime Derby Tool
- VectorVest Simulator
- VectorVest Variator
- VectorVest Watchdog
