

HOT TOPICS LIST
- MACD
- Fibonacci
- RSI
- Gann
- ADXR
- Stochastics
- Volume
- Triangles
- Futures
- Cycles
- Volatility
- ZIGZAG
- MESA
- Retracement
- Aroon
INDICATORS LIST
LIST OF TOPICS
PRINT THIS ARTICLE
by Stella Osoba, CMT
Gaps are areas on a price chart where no trading has taken place during a certain trading period. There could be any number of reasons for the presence of gaps, but one of the most common is a quarterly earnings surprise.
Position: N/A
Stella Osoba, CMT
Stella Osoba is a trader and financial writer. She is a frequent contributor to "Technical Analysis of Stocks and Commodities" magazine and "Traders.com Advantage" as well as other financial publications.
PRINT THIS ARTICLE
TECHNICAL ANALYSIS
Trading Earnings Gaps
02/14/19 04:51:35 PMby Stella Osoba, CMT
Gaps are areas on a price chart where no trading has taken place during a certain trading period. There could be any number of reasons for the presence of gaps, but one of the most common is a quarterly earnings surprise.
Position: N/A
| International Business Machines (IBM), nicknamed Big Blue, is a well known large cap technology company, and one of the 30 companies included in the Dow Jones Industrial Average (DOW). It has been around since its founding in 1911. With a current market capitalization of $121.86 billion, it is also one of the world's largest employers with approximately 380,000 employees worldwide as of 2017. |
|
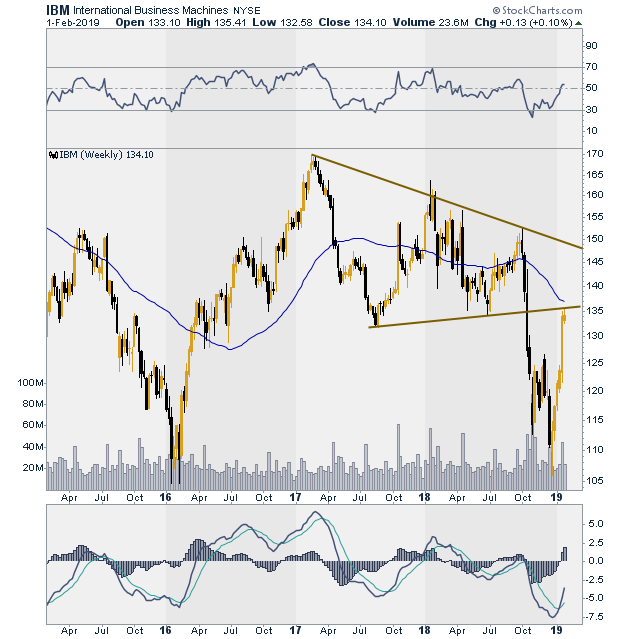
| Figure 1. Weekly chart for IBM. |
| Graphic provided by: StockCharts.com. |
| |
| Figure 1 is weekly chart of IBM showing that after its high in February 2017, it formed a symmetrical triangle before breaking to the downside and forming a double bottom price pattern. IBM is not a very volatile stock with a 12 month price range of a high of 164.13 and a low of 105.94. It does, however, have volatile moments, usually around earnings. |
|
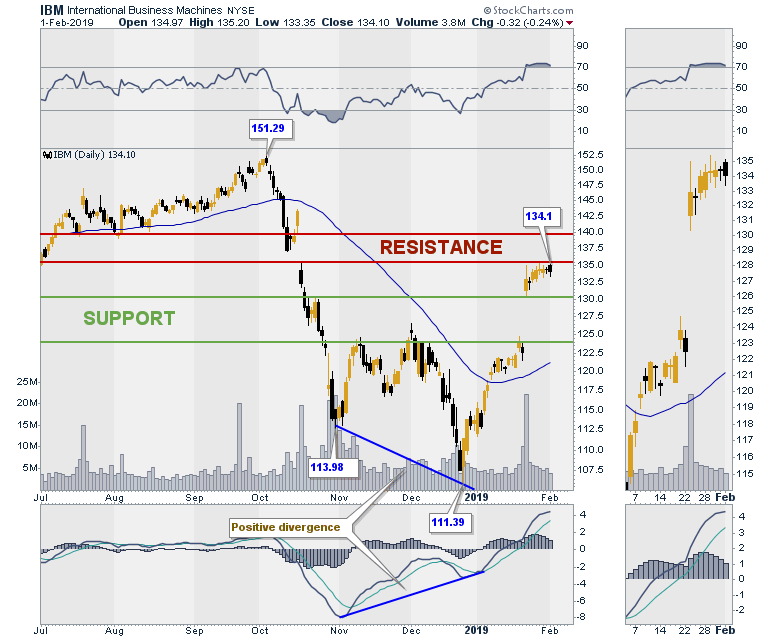
| Figure 2. Daily IBM chart showing support and resistance zones created by gaps. |
| Graphic provided by: StockCharts.com. |
| |
| Figure 2 is a daily chart of IBM clearly showing its double bottom which forms a bullish W shaped pattern. The double bottom also forms a positive divergence with the MACD which is another bullish sign. The price rise after the second bottom takes price up through the 50-day moving average. On January 22, 2019, after market close, IBM announced quarterly earnings. Price opened the next day on a huge gap up as we can see on the chart. The whole area of the gap now becomes new support (area bounded by green horizontal lines). |
| For the 8 days following the earnings announcement, IBM has traded above support as we can see in Figure 2. It is interesting to notice that the resistance is the area of a prior gap caused by the earnings announcement on October 16, 2018. Then the earnings announcement disappointed and price gapped down at the open on the following day. The whole of that area became resistance (area bounded by red horizontal lines). The resistance area which is still in effect, remains in effect until price is able to break above the higher of the two horizontal lines at which time the old resistance area will become new support. |
Stella Osoba is a trader and financial writer. She is a frequent contributor to "Technical Analysis of Stocks and Commodities" magazine and "Traders.com Advantage" as well as other financial publications.
| E-mail address: | stellaosoba@gmail.com |
Click here for more information about our publications!
Comments
Date:�03/28/19Rank:�5Comment:�

Request Information From Our Sponsors
- StockCharts.com, Inc.
- Candle Patterns
- Candlestick Charting Explained
- Intermarket Technical Analysis
- John Murphy on Chart Analysis
- John Murphy's Chart Pattern Recognition
- John Murphy's Market Message
- MurphyExplainsMarketAnalysis-Intermarket Analysis
- MurphyExplainsMarketAnalysis-Visual Analysis
- StockCharts.com
- Technical Analysis of the Financial Markets
- The Visual Investor
- VectorVest, Inc.
- Executive Premier Workshop
- One-Day Options Course
- OptionsPro
- Retirement Income Workshop
- Sure-Fire Trading Systems (VectorVest, Inc.)
- Trading as a Business Workshop
- VectorVest 7 EOD
- VectorVest 7 RealTime/IntraDay
- VectorVest AutoTester
- VectorVest Educational Services
- VectorVest OnLine
- VectorVest Options Analyzer
- VectorVest ProGraphics v6.0
- VectorVest ProTrader 7
- VectorVest RealTime Derby Tool
- VectorVest Simulator
- VectorVest Variator
- VectorVest Watchdog