

HOT TOPICS LIST
- MACD
- Fibonacci
- RSI
- Gann
- ADXR
- Stochastics
- Volume
- Triangles
- Futures
- Cycles
- Volatility
- ZIGZAG
- MESA
- Retracement
- Aroon
INDICATORS LIST
LIST OF TOPICS
PRINT THIS ARTICLE
by Stella Osoba, CMT
Michael Kors acquired Jimmy Choo for $896 million in 2017 and Versace for $2.1 billion in 2018. The company also changed its name to Capri Holdings (CPRI). With these two acquisitions, CPRI looks set to overhaul the existing power structure of global fashion long dominated by French, Swiss and Italian conglomerates by creating the first American luxury fashion conglomerate. How will its share price fare?
Position: N/A
Stella Osoba, CMT
Stella Osoba is a trader and financial writer. She is a frequent contributor to "Technical Analysis of Stocks and Commodities" magazine and "Traders.com Advantage" as well as other financial publications.
PRINT THIS ARTICLE
TECHNICAL ANALYSIS
From KORS to CPRI
02/07/19 04:14:19 PMby Stella Osoba, CMT
Michael Kors acquired Jimmy Choo for $896 million in 2017 and Versace for $2.1 billion in 2018. The company also changed its name to Capri Holdings (CPRI). With these two acquisitions, CPRI looks set to overhaul the existing power structure of global fashion long dominated by French, Swiss and Italian conglomerates by creating the first American luxury fashion conglomerate. How will its share price fare?
Position: N/A
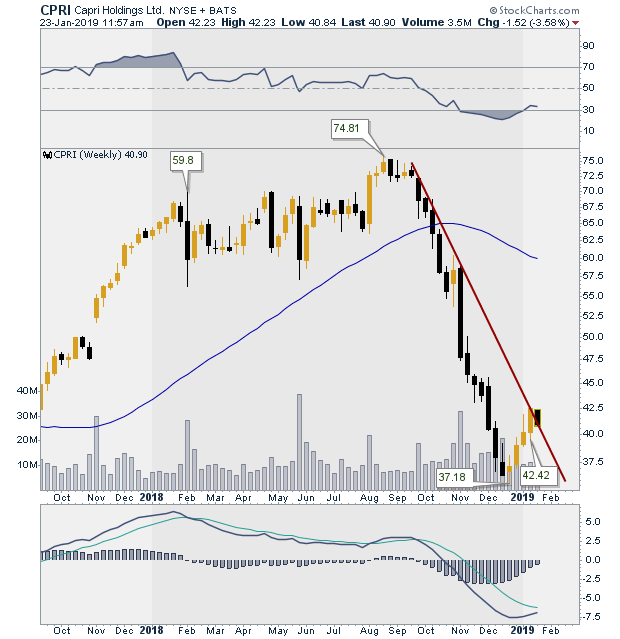
| CPRI, formerly KORS, had been in a bruising downtrend in the last few months of 2018, with its stock price losing more than half its value in a few months, as price fell from a high of 75.96 in August 2018 to a low of 35.68 in December 2018. With the current acquisition of Versace, are there any signs of a reversal in the charts? |
|
| Figure 1. Weekly Chart For CPRI. |
| Graphic provided by: StockCharts.com. |
| |
| Figure 1 is a weekly chart of the company showing very clearly the steep down trend of price in the last quarter of 2018. The price low came on December 24, 2018, at 35.68. Price has subsequently rebounded and has broken the weekly down trend line. To study whether this move up can be sustained let us look at daily chart. |
|
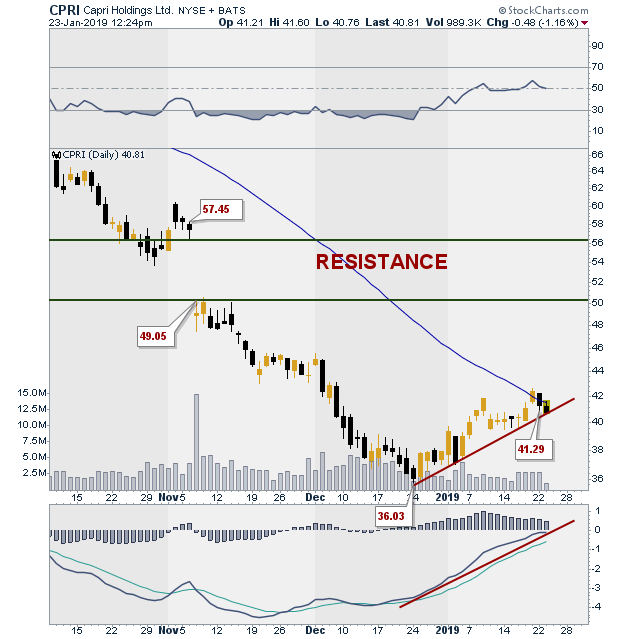
| Figure 2. Daily Chart for CPRI. |
| Graphic provided by: StockCharts.com. |
| |
| Figure 2 is a daily chart of CPRI. Price has rebounded back to the 50-day moving average but is struggling to stay above it. The RSI in the box above price and the MACD in the box below price both confirm the current price move. If price breaks below the up trend line, that is not necessarily a bad thing. Look for a successful test of the December price lows. If price makes a new low then the price rise was simply a reaction in the continuing downtrend. If, however, price makes a successful test or keeps above the 50-day moving average, the next challenge will be the resistance zone above. |
| When price gapped down on November 6, 2018, price fell from 57.45 at the close on that day to 49.05 at the close on the following day. A glance at the chart will show that this gap has not yet been closed. Most gaps will eventually get closed, but this should never be the reason to take a trade. We cannot know from a glance at the chart whether the gap will close during this reaction. Until price manages to close above the high formed during the gap down, the entire area of the gap remains resistance, which means that even if price were to continue higher, the area of resistance may see increased selling pressure as those who were caught holding long positions prior to the gap down try to get out whole. |
| Technical analysis allows us to study price charts looking for answers to short term price moves. The analysis looks to all the available evidence to make an assessment of price action. A preponderance of the evidence approach, plus doses of humility, is the best approach to reading price action. The market will and can do anything. |
Stella Osoba is a trader and financial writer. She is a frequent contributor to "Technical Analysis of Stocks and Commodities" magazine and "Traders.com Advantage" as well as other financial publications.
| E-mail address: | stellaosoba@gmail.com |
Click here for more information about our publications!
PRINT THIS ARTICLE

Request Information From Our Sponsors
- StockCharts.com, Inc.
- Candle Patterns
- Candlestick Charting Explained
- Intermarket Technical Analysis
- John Murphy on Chart Analysis
- John Murphy's Chart Pattern Recognition
- John Murphy's Market Message
- MurphyExplainsMarketAnalysis-Intermarket Analysis
- MurphyExplainsMarketAnalysis-Visual Analysis
- StockCharts.com
- Technical Analysis of the Financial Markets
- The Visual Investor
- VectorVest, Inc.
- Executive Premier Workshop
- One-Day Options Course
- OptionsPro
- Retirement Income Workshop
- Sure-Fire Trading Systems (VectorVest, Inc.)
- Trading as a Business Workshop
- VectorVest 7 EOD
- VectorVest 7 RealTime/IntraDay
- VectorVest AutoTester
- VectorVest Educational Services
- VectorVest OnLine
- VectorVest Options Analyzer
- VectorVest ProGraphics v6.0
- VectorVest ProTrader 7
- VectorVest RealTime Derby Tool
- VectorVest Simulator
- VectorVest Variator
- VectorVest Watchdog