

HOT TOPICS LIST
- MACD
- Fibonacci
- RSI
- Gann
- ADXR
- Stochastics
- Volume
- Triangles
- Futures
- Cycles
- Volatility
- ZIGZAG
- MESA
- Retracement
- Aroon
INDICATORS LIST
LIST OF TOPICS
PRINT THIS ARTICLE
by Stella Osoba, CMT
The hammer is one of the classic candlestick chart patterns that studies have shown tend to be more reliable than other candlestick patterns. But as sometimes happens, even the most reliable of patterns will fail. What do you do when this happens?
Position: N/A
Stella Osoba, CMT
Stella Osoba is a trader and financial writer. She is a frequent contributor to "Technical Analysis of Stocks and Commodities" magazine and "Traders.com Advantage" as well as other financial publications.
PRINT THIS ARTICLE
TECHNICAL ANALYSIS
When Hammers Fail
01/29/19 04:23:37 PMby Stella Osoba, CMT
The hammer is one of the classic candlestick chart patterns that studies have shown tend to be more reliable than other candlestick patterns. But as sometimes happens, even the most reliable of patterns will fail. What do you do when this happens?
Position: N/A
| The hammer has a small real body, black or white (the color is not as important as the pattern itself). The real body should be near, or at, the highs of the session. The hammer has a long lower shadow, which must be at least two to three times the height of the real body. You identify the hammer based on where it appears. A hammer will not appear in an uptrend. It can only appear in a downtrend, preferably after a new low. The Japanese say that the hammer shows that the market is hammering out a base. The low of the hammer is likely to be the low of the move. But the low of the pattern can also tell us when the pattern is not acting right, or when it has failed. SNAP inc. (SNAP) provides an instructive example of a failed hammer pattern. |
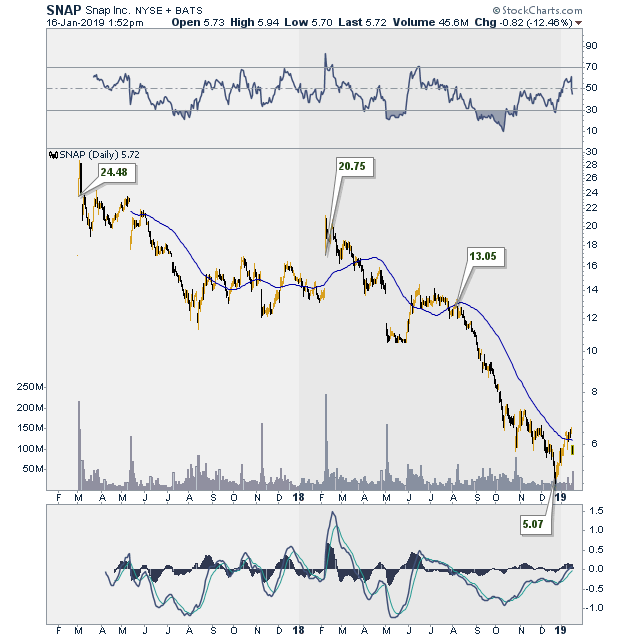
| SNAP started life as a messaging app. Built into its programming was the ability to make pictures and videos sent over its platform disappear after they are viewed. This app became very popular with millennials, especially. In its second quarter earnings release last year, the company reported 188 million daily active users worldwide. SNAP debuted on the NYSE on March 2, 2017 at $24 per share giving it a market capitalization of about $33 billion (See Figure 1). But then the good news was over for early investors. |
|
| Figure 1. SNAP Daily Chart. |
| Graphic provided by: StockCharts.com. |
| |
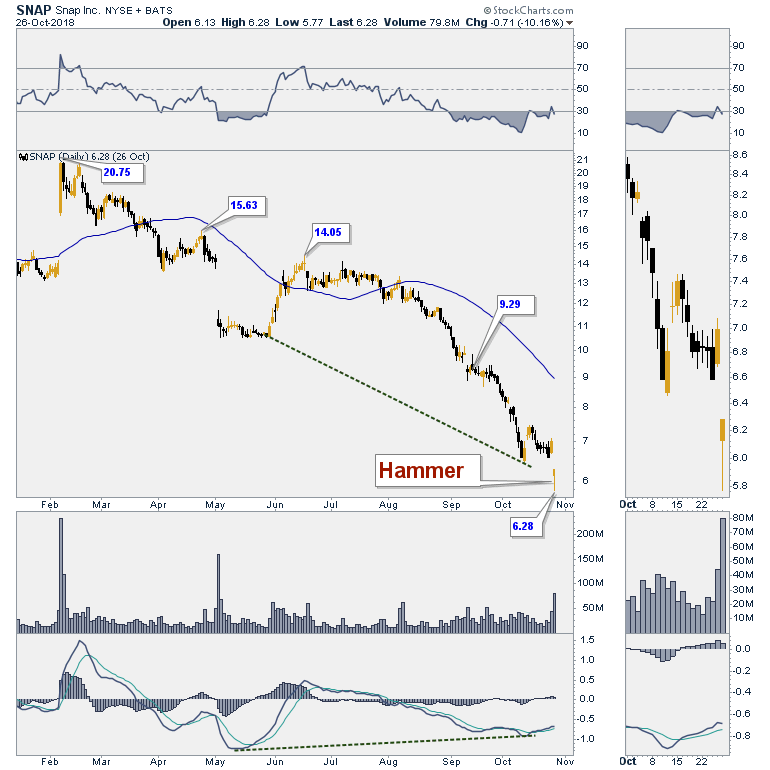
| SNAP's price proceeded to enter into an extended rout. Falling from $24 per share to a low of $4.82 on December 21, 2018. But along the way, there was the hammer (See Figure 2). On October 26, 2018, price gapped down and then a hammer formed. Though the gap down was bearish, the hammer was bullish. The shadow was at least twice that of the real body. Price closed at the high of $6.28. Volume, while not double the previous day's 44 million, came respectably close at 80 million. To cap it off, there was positive divergence with both the MACD and RSI. This was a trade that should not have gone wrong. But it did. |
|
| Figure 2. SNAP daily chart showing Hammer candlestick in late October 2018. |
| Graphic provided by: StockCharts.com. |
| |
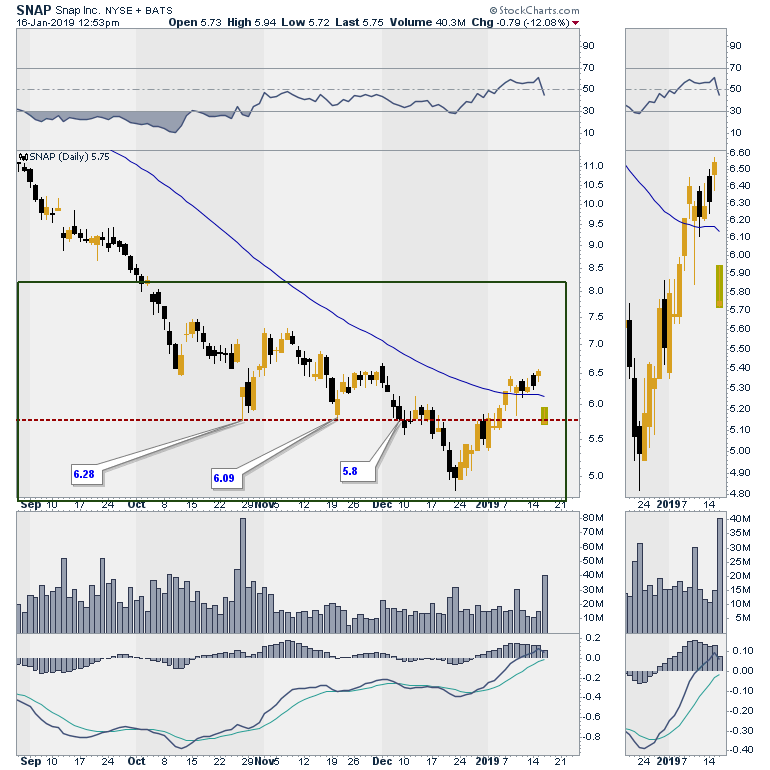
| Price tested the low of the hammer twice, on November 20, 2018 and December 6, 2018. On December 7, 2018 price dipped to a new low at $5.75 before closing at the low of the previous day which was $5.80 (See Figure 3). On December 10, 2018, support had clearly failed as price closed below the $5.80 level, which was the low of the hammer and which had held up till now. The correct strategy, if you had entered a long trade on expectation that he hammer signaled the bottom, would have been to exit the trade at the point where your original analysis was invalidated, which was at the close below the low of the hammer. |
|
| Figure 3. SNAP daily chart showing failed Hammer pattern. |
| Graphic provided by: StockCharts.com. |
| |
| After making a new low on December 21, 2018 of $4.82, price rebounded. It found resistance at the old support line (see Figure 3) and stayed below it for 4 days before breaking above it. The move above the 50-day moving average was bullish, but the gap down below the moving average means that SNAP's downtrend cannot be ruled to be over. Now is the time to wait and watch to see if SNAP can put in a decent bottom (a sideways trading range) to act as support to a sustained uptrend. As always this article is educational only. |
Stella Osoba is a trader and financial writer. She is a frequent contributor to "Technical Analysis of Stocks and Commodities" magazine and "Traders.com Advantage" as well as other financial publications.
| E-mail address: | stellaosoba@gmail.com |
Click here for more information about our publications!
PRINT THIS ARTICLE

Request Information From Our Sponsors
- VectorVest, Inc.
- Executive Premier Workshop
- One-Day Options Course
- OptionsPro
- Retirement Income Workshop
- Sure-Fire Trading Systems (VectorVest, Inc.)
- Trading as a Business Workshop
- VectorVest 7 EOD
- VectorVest 7 RealTime/IntraDay
- VectorVest AutoTester
- VectorVest Educational Services
- VectorVest OnLine
- VectorVest Options Analyzer
- VectorVest ProGraphics v6.0
- VectorVest ProTrader 7
- VectorVest RealTime Derby Tool
- VectorVest Simulator
- VectorVest Variator
- VectorVest Watchdog
- StockCharts.com, Inc.
- Candle Patterns
- Candlestick Charting Explained
- Intermarket Technical Analysis
- John Murphy on Chart Analysis
- John Murphy's Chart Pattern Recognition
- John Murphy's Market Message
- MurphyExplainsMarketAnalysis-Intermarket Analysis
- MurphyExplainsMarketAnalysis-Visual Analysis
- StockCharts.com
- Technical Analysis of the Financial Markets
- The Visual Investor