

HOT TOPICS LIST
- MACD
- Fibonacci
- RSI
- Gann
- ADXR
- Stochastics
- Volume
- Triangles
- Futures
- Cycles
- Volatility
- ZIGZAG
- MESA
- Retracement
- Aroon
INDICATORS LIST
LIST OF TOPICS
PRINT THIS ARTICLE
by Stella Osoba, CMT
With the partial government shut down now breaking records as the longest in U.S. history, some 800,000 furloughed workers are facing varying levels of financial insecurity. According to a 2017 report by CareerBuilder, the employment website, 78% of American workers are living paycheck to paycheck. This means that for workers already undergoing financial stress, missing credit card payments may be unavoidable. The impact on credit scores of missed payments varies depending on whether it is part of a pattern or a one off. While one 30-day late payment should not cause lasting damage, a late 60-day payment will likely do more damage. Today, we turn our spotlight to one of the companies that is constantly shining its own spotlight on us. As one of the three main credit reporting companies in the U.S., this article will take a quick technical look at the price behavior of Transunion (TRU).
Position: N/A
Stella Osoba, CMT
Stella Osoba is a trader and financial writer. She is a frequent contributor to "Technical Analysis of Stocks and Commodities" magazine and "Traders.com Advantage" as well as other financial publications.
PRINT THIS ARTICLE
TECHNICAL ANALYSIS
Transunion
01/17/19 04:15:44 PMby Stella Osoba, CMT
With the partial government shut down now breaking records as the longest in U.S. history, some 800,000 furloughed workers are facing varying levels of financial insecurity. According to a 2017 report by CareerBuilder, the employment website, 78% of American workers are living paycheck to paycheck. This means that for workers already undergoing financial stress, missing credit card payments may be unavoidable. The impact on credit scores of missed payments varies depending on whether it is part of a pattern or a one off. While one 30-day late payment should not cause lasting damage, a late 60-day payment will likely do more damage. Today, we turn our spotlight to one of the companies that is constantly shining its own spotlight on us. As one of the three main credit reporting companies in the U.S., this article will take a quick technical look at the price behavior of Transunion (TRU).
Position: N/A
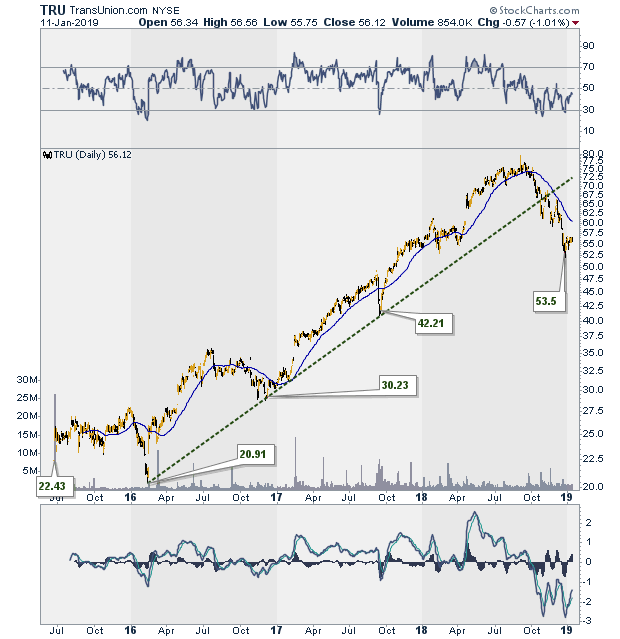
| TRU went public on June 24, 2015. It's share price was listed on the NYSE at 22.20. After trading sideways for several months, its price hit a low of 20.36 on February 11, 2016. After that price low, the stock recovered and entered a prolonged uptrend (See Figure 1). Price rose to touch a high of 79.38 on September 4, 2018. Apart from minor pullbacks along the way, the stocks ascent seemed unassailable. When on September 11, 2018, and again on October 3rd, 2018, TRU failed to surpass the earlier September 4, price high, eagle-eyed analysts would have started to question the continuation of the uptrend. As the 50-day moving average began to turn down and price began to consistently trade below it, the trend damage became clear. |
|
| Figure 1. Daily chart for TRU from July 2016 - January 2019. |
| Graphic provided by: StockCharts.com. |
| |
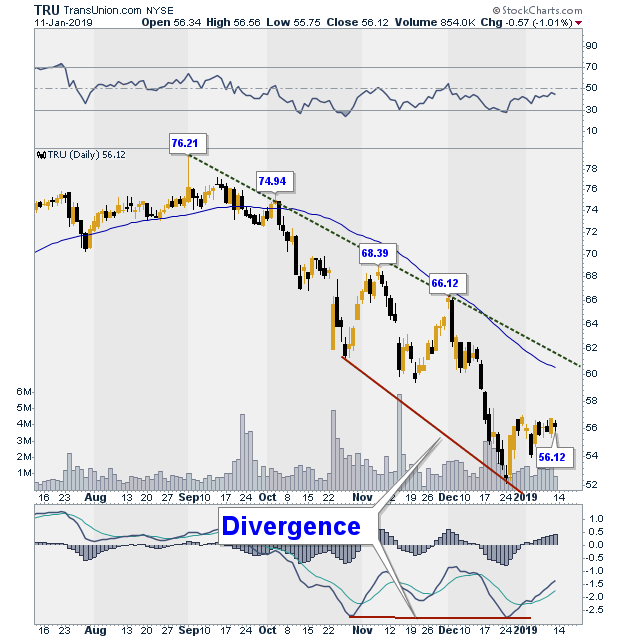
| The downtrend line in Figure 2 clearly shows the new trend with price making lower lows and lower highs. The question now is whether TRU's December 24, 2018 low of 52.15 is the price bottom? Will price close lower or will the price low hold? This is a question not easily answered with the current data. There has been no price test of the lows to make the job any easier. While the cross over of the MACD line over the signal line in the MACD panel below price is positive, so is the positive divergence of the MACI, RSI and price (RSI is in the panel above price). The divergence here shows that while price is making lower lows, the indicators are not. This lack of confirmation is positive. It points to the price decline running out of momentum which could signal higher prices ahead as part of a reaction in the downtrend or a reversal. |
|
| Figure 2. Daily chart for TRU showing recent downtrend. |
| Graphic provided by: StockCharts.com. |
| |
| While it is a desire of some to enter a long trade at the low and exit at the high, more seasoned traders understand why this is unnecessary. The risk taken on a trade has to be balanced with potential outcomes. Since technical analysis requires a balance of evidence approach to decision making, it is often better to wait and let the market prove your theory of price behavior is likely to be right before entering a trade. In this case, it could be making sure that the price low in December 2018 is successfully tested. It could mean a break above the 50-day MA or the downtrend line. It could also mean waiting for the stock to put in higher highs and higher lows or any one of a potential number of signals emanating from the behavior of price. |
| Patience requires discipline and the ability to pass on a trade when information shows that what was anticipated is not in fact what is happening. Sometimes we hurt our trading by being too tightly wedded to our analysis. The goal should never be to be proven right, it should always be to adjust in real time, to the information that the market is signaling by its behavior. |
| As always, remember that this piece is for educational purposes only. |
Stella Osoba is a trader and financial writer. She is a frequent contributor to "Technical Analysis of Stocks and Commodities" magazine and "Traders.com Advantage" as well as other financial publications.
| E-mail address: | stellaosoba@gmail.com |
Click here for more information about our publications!
PRINT THIS ARTICLE

Request Information From Our Sponsors
- StockCharts.com, Inc.
- Candle Patterns
- Candlestick Charting Explained
- Intermarket Technical Analysis
- John Murphy on Chart Analysis
- John Murphy's Chart Pattern Recognition
- John Murphy's Market Message
- MurphyExplainsMarketAnalysis-Intermarket Analysis
- MurphyExplainsMarketAnalysis-Visual Analysis
- StockCharts.com
- Technical Analysis of the Financial Markets
- The Visual Investor
- VectorVest, Inc.
- Executive Premier Workshop
- One-Day Options Course
- OptionsPro
- Retirement Income Workshop
- Sure-Fire Trading Systems (VectorVest, Inc.)
- Trading as a Business Workshop
- VectorVest 7 EOD
- VectorVest 7 RealTime/IntraDay
- VectorVest AutoTester
- VectorVest Educational Services
- VectorVest OnLine
- VectorVest Options Analyzer
- VectorVest ProGraphics v6.0
- VectorVest ProTrader 7
- VectorVest RealTime Derby Tool
- VectorVest Simulator
- VectorVest Variator
- VectorVest Watchdog