HOT TOPICS LIST
- MACD
- Fibonacci
- RSI
- Gann
- ADXR
- Stochastics
- Volume
- Triangles
- Futures
- Cycles
- Volatility
- ZIGZAG
- MESA
- Retracement
- Aroon
INDICATORS LIST
LIST OF TOPICS
PRINT THIS ARTICLE
by Stella Osoba, CMT
Spotify Technology (SPOT) is the popular global music streaming platform used by over 190 million monthly active users worldwide as of November 2018. SPOT's Initial Public Offering (IPO) was on April 3, 2018 and despite the fact that on that day it opened at 165.90 and closed at 149.01, its IPO was generally considered to be a success.
Position: N/A
Stella Osoba, CMT
Stella Osoba is a trader and financial writer. She is a frequent contributor to "Technical Analysis of Stocks and Commodities" magazine and "Traders.com Advantage" as well as other financial publications.
PRINT THIS ARTICLE
TECHNICAL ANALYSIS
When Divergences Work
01/10/19 03:22:35 PMby Stella Osoba, CMT
Spotify Technology (SPOT) is the popular global music streaming platform used by over 190 million monthly active users worldwide as of November 2018. SPOT's Initial Public Offering (IPO) was on April 3, 2018 and despite the fact that on that day it opened at 165.90 and closed at 149.01, its IPO was generally considered to be a success.
Position: N/A
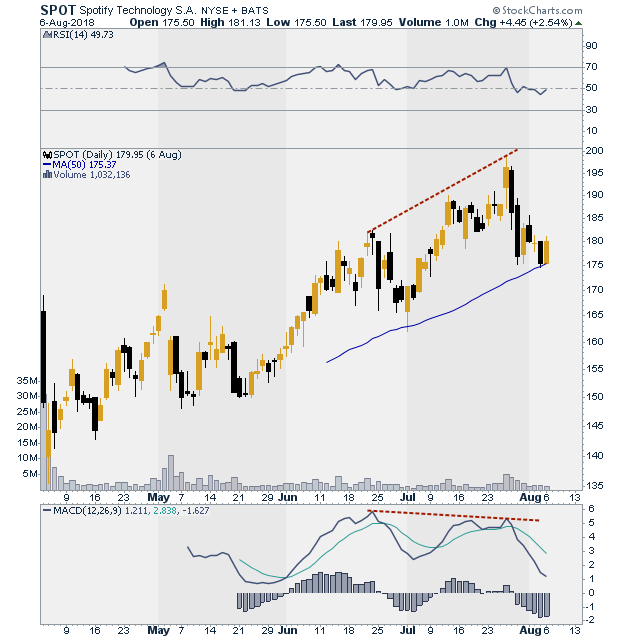
| On July 26, 2018, SPOT's share price reached a high of 198.99. Those expecting higher and even higher prices were disappointed, but the astute trader would have noticed that after the high of June 22, 2018, the MACD stopped confirming further highs. As price continued to make highs on July 12, 2018 and July 26, 2018 the MACD made lower highs (See Figure 1). When price is making higher highs, but the indicator is making lower highs, this is known as negative divergence. Negative divergence means that price is losing its momentum. This is sometimes an early warning that future declines are ahead. |

|
| Figure 1. Daily chart for SPOT with negative divergence between price and MACD indicator. |
| Graphic provided by: StockCharts.com. |
| |
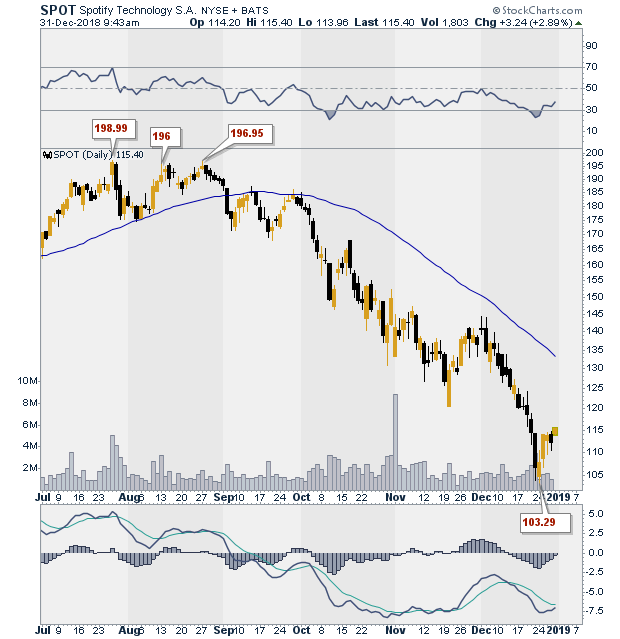
| No doubt, with the success of SPOT's IPO and with the optimism surrounding higher and higher prices, it would have been easy to miss the signals that were warning that all was not well with price. SPOT made three attempts to break above 200, on August 13, 2018 and August 27, 2018. Each time SPOT failed. The signals of the coming price decline were the negative divergence with both the MACD and RSI, and price leading up to SPOT's price high, and then the two failed attempts to break above the high of July 26, 2018. |

|
| Figure 2. Daily chart for SPOT showing decline that followed the divergence. |
| Graphic provided by: StockCharts.com. |
| |
| The break below its 50-day moving average on September 5, 2018 was decisive and would have alerted the shorts to take positions. The downtrend that ensued was brutal. Price dropped to a low of 103.29 on December 24, 2018, which was almost a 50% decline from its high. |
| With a decline so severe, it is possible that a reaction might be in store for this stock. A reaction could mean that future price declines are in store. But it would be useful to study the stock to see what it does. If SPOT continues to make lower lows but the MACD does not, or price action shows signs of positive divergence with its indicators, then it might be an early sign that the trend might be changing. Two things to note, however, trend changes take time, and divergences do not always work. Please note that this article is for educational purposes only and does not suggest you take a position in this stock. |
Stella Osoba is a trader and financial writer. She is a frequent contributor to "Technical Analysis of Stocks and Commodities" magazine and "Traders.com Advantage" as well as other financial publications.
| E-mail address: | stellaosoba@gmail.com |
Click here for more information about our publications!
PRINT THIS ARTICLE

Request Information From Our Sponsors
- VectorVest, Inc.
- Executive Premier Workshop
- One-Day Options Course
- OptionsPro
- Retirement Income Workshop
- Sure-Fire Trading Systems (VectorVest, Inc.)
- Trading as a Business Workshop
- VectorVest 7 EOD
- VectorVest 7 RealTime/IntraDay
- VectorVest AutoTester
- VectorVest Educational Services
- VectorVest OnLine
- VectorVest Options Analyzer
- VectorVest ProGraphics v6.0
- VectorVest ProTrader 7
- VectorVest RealTime Derby Tool
- VectorVest Simulator
- VectorVest Variator
- VectorVest Watchdog
- StockCharts.com, Inc.
- Candle Patterns
- Candlestick Charting Explained
- Intermarket Technical Analysis
- John Murphy on Chart Analysis
- John Murphy's Chart Pattern Recognition
- John Murphy's Market Message
- MurphyExplainsMarketAnalysis-Intermarket Analysis
- MurphyExplainsMarketAnalysis-Visual Analysis
- StockCharts.com
- Technical Analysis of the Financial Markets
- The Visual Investor
