HOT TOPICS LIST
- MACD
- Fibonacci
- RSI
- Gann
- ADXR
- Stochastics
- Volume
- Triangles
- Futures
- Cycles
- Volatility
- ZIGZAG
- MESA
- Retracement
- Aroon
INDICATORS LIST
LIST OF TOPICS
PRINT THIS ARTICLE
by Matt Blackman
To many market pundits and traders, technical and fundamental analyses mix about as well as oil and vinegar. But here is one match-up that works nicely for those who know the recipe.
Position: N/A
Matt Blackman
Matt Blackman is a full-time technical and financial writer and trader. He produces corporate and financial newsletters, and assists clients in getting published in the mainstream media. Matt has earned the Chartered Market Technician (CMT) designation. Follow Matt on Twitter at www.twitter.com/RatioTrade
PRINT THIS ARTICLE
PRICE/EARNINGS RATIO
The Chartists' Fundamental Helper
01/03/19 04:18:17 PMby Matt Blackman
To many market pundits and traders, technical and fundamental analyses mix about as well as oil and vinegar. But here is one match-up that works nicely for those who know the recipe.
Position: N/A
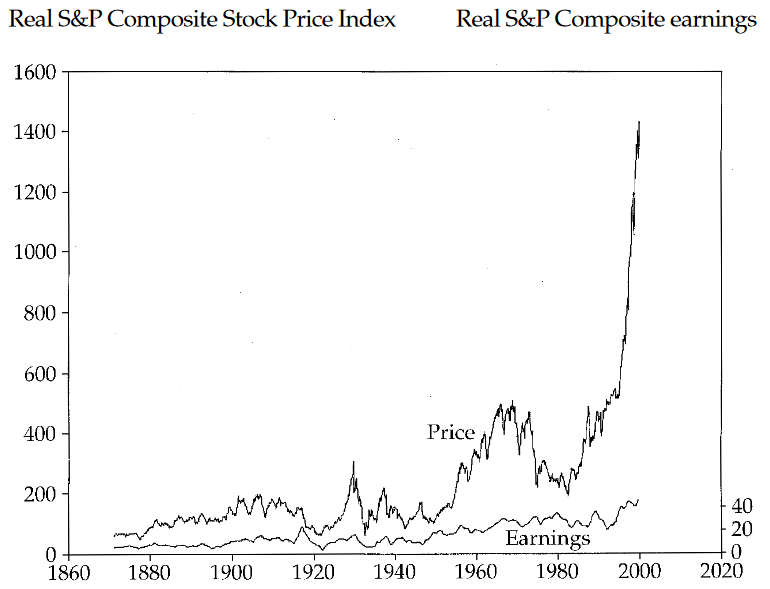
| In March 2000, economist Dr. Robert Shiller published "Irrational Exuberance". Coincidentally it was the same month that US stock prices were hitting 20th century all-time highs. The term had come from a December 1996 speech by then Federal Reserve Chair Dr Alan Greenspan in which he discussed historic asset bubbles and asked, "How do we know when irrational exuberance has unduly escalated asset values?" Although his concerns were warranted, it would take another three years for the US stock bubble to finally break. In the preface of this book, Dr Shiller issued the following eerily prophetic warning. "At present there is a whiff of extravagant expectation, if not irrational exuberance, in the air. People are optimistic about the stock market. There is a lack of sobriety about its downside and the consequences that would ensue as a result. If the Dow were to drop to 6,000, the loss would represent something like the equivalent value of the entire housing stock of the United States." And the first chart in the Shiller's book clearly demonstrated just how exuberant stock prices had become by early 2000 (see Figure 1). Less than three years after hitting its January 2000 peak, the Dow had shed more than 4,500 points and lost more than 40%. The tech heavy Nasdaq Composite lost more than 70%. But more importantly, what lessons can we learn about the market today? |

|
| Figure 1. Historic look at S&P 500. |
| Graphic provided by: N/A. |
| |
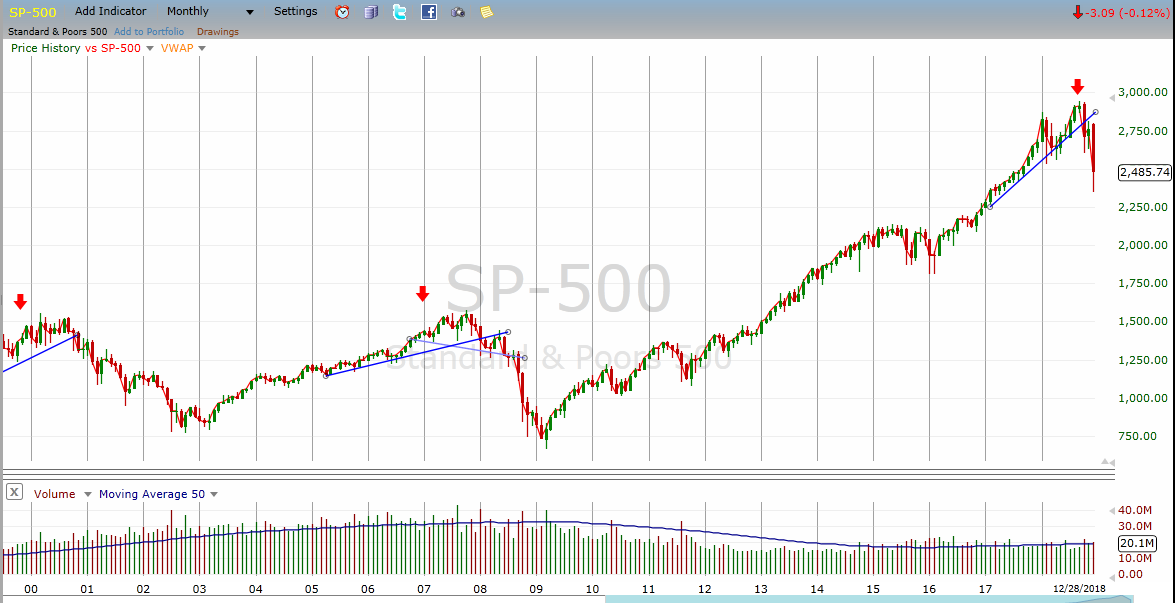
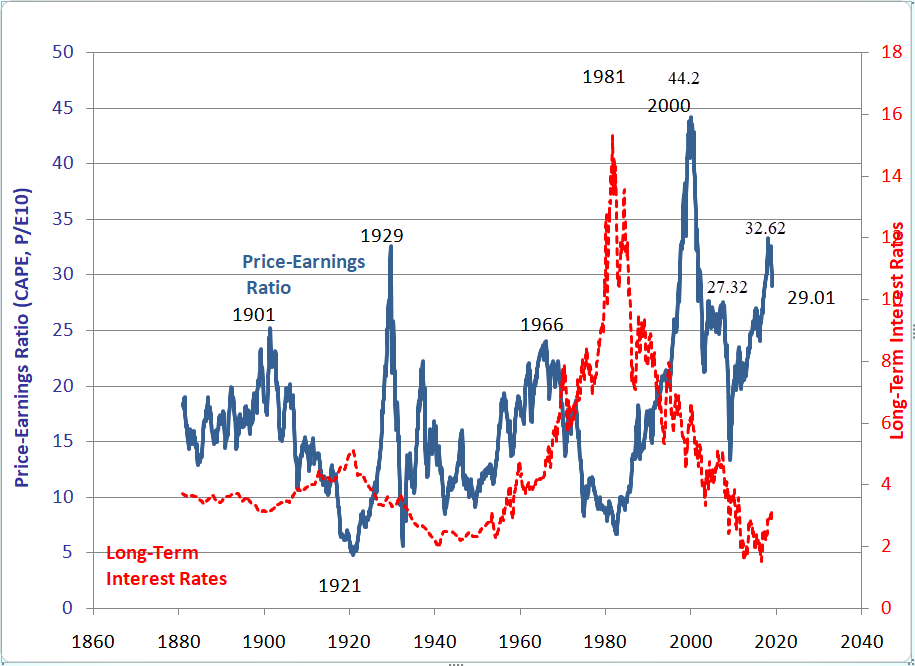
| In Figure 2, we see the monthly chart of the S&P500 Index between 1999 and December 2018. (The red arrows show peaks in Shiller's CAPE in Figure 3.) So what is CAPE? It is the acronym for trailing the S&P500 Cyclically Adjusted Price Earnings ratio. Most PE ratios go back 12 months. CAPE uses the last 120 months of data. The reason is that it smooths the results to reduce volatility. As we can see from the red arrows showing CAPE peaks in Figure 2, it has worked quite well as an early warning of S&P500 peaks. |

|
| Figure 2. S&P 500 Monthly Chart. |
| Graphic provided by: Freestockcharts.com. |
| |
| So where were we as 2018 came to a close? As of the last week in December, the SPX had fallen 19.8% from its October peak before recovering somewhat two days after Christmas. A drop of 20% is generally required to formally label a bear market. After peaking at 32.62 in September 2018, CAPE had dropped to 29.01 by mid-December and that was before the pre-Christmas market humbug that saw the SPX drop another 11% before hitting bottom December 24. |

|
| Figure 3. CAPE vs. Long-Term Interest Rates. |
| Graphic provided by: N/A. |
| |
| Yes, there was a powerful 1300+ point Dow and 138 point SPX rally right after Christmas, but it's important to remember that the biggest rallies have historically occurred during bear markets. The $64 million dollar question remains. Was the post Christmas frenzy just a bear rally or a promising sign that the bull has returned? As we see from Figure 3, a rally of any magnitude after the CAPE has peaked and fallen significantly is a rare occurrence indeed. Another concern is that these big SPX up-moves occurred on average volume that showed little signs that buyers were buying en masse — and that is bearish. Perhaps the bigger lesson is that as a fundamental indicator, CAPE has shown that it is a reasonably good leading indicator of stock market chart selling peaks. Stay tuned for our next article discussing just how well it has worked for anticipating buying troughs. |
| Reading List: Alan Greenspan's "Irrational Exuberance" Speech https://www.federalreserve.gov/boarddocs/speeches/1996/19961205.htm Books by Dr Robert Shiller http://www.econ.yale.edu/~shiller/books.htm Blackman, Matt [2011] 10 Signs That Tell You When To Stop Trading Stocks & Commodities V. 30:13 (60-63): http://technical.traders.com/archive/articlefinal.asp?file=\V30\C13\509BLAC.pdf |
Matt Blackman is a full-time technical and financial writer and trader. He produces corporate and financial newsletters, and assists clients in getting published in the mainstream media. Matt has earned the Chartered Market Technician (CMT) designation. Follow Matt on Twitter at www.twitter.com/RatioTrade
| Title: | Author |
| Company: | TradeSystemGuru |
| Address: | Box 2589 |
| Garibaldi Highlands, BC V0N1T0 | |
| Phone # for sales: | 6048989069 |
| E-mail address: | indextradermb@gmail.com |
Traders' Resource Links | |
| TradeSystemGuru has not added any product or service information to TRADERS' RESOURCE. | |
Click here for more information about our publications!
PRINT THIS ARTICLE

Request Information From Our Sponsors
- VectorVest, Inc.
- Executive Premier Workshop
- One-Day Options Course
- OptionsPro
- Retirement Income Workshop
- Sure-Fire Trading Systems (VectorVest, Inc.)
- Trading as a Business Workshop
- VectorVest 7 EOD
- VectorVest 7 RealTime/IntraDay
- VectorVest AutoTester
- VectorVest Educational Services
- VectorVest OnLine
- VectorVest Options Analyzer
- VectorVest ProGraphics v6.0
- VectorVest ProTrader 7
- VectorVest RealTime Derby Tool
- VectorVest Simulator
- VectorVest Variator
- VectorVest Watchdog
- StockCharts.com, Inc.
- Candle Patterns
- Candlestick Charting Explained
- Intermarket Technical Analysis
- John Murphy on Chart Analysis
- John Murphy's Chart Pattern Recognition
- John Murphy's Market Message
- MurphyExplainsMarketAnalysis-Intermarket Analysis
- MurphyExplainsMarketAnalysis-Visual Analysis
- StockCharts.com
- Technical Analysis of the Financial Markets
- The Visual Investor
