HOT TOPICS LIST
- MACD
- Fibonacci
- RSI
- Gann
- ADXR
- Stochastics
- Volume
- Triangles
- Futures
- Cycles
- Volatility
- ZIGZAG
- MESA
- Retracement
- Aroon
INDICATORS LIST
LIST OF TOPICS
PRINT THIS ARTICLE
by Stella Osoba, CMT
GrubHub, Inc. (GRUB) is the mobile and online platform company that allows people to order meals from numerous restaurants for pick-up and delivery. On September 14, 2018, its share price closed at a high of 146.11. Just over three months later, on December 24, 2018, the share price had plunged to close at a low of 67.84. Let's review the technicals to see if they can tell us if the worst is over for the stock.
Position: N/A
Stella Osoba, CMT
Stella Osoba is a trader and financial writer. She is a frequent contributor to "Technical Analysis of Stocks and Commodities" magazine and "Traders.com Advantage" as well as other financial publications.
PRINT THIS ARTICLE
TECHNICAL ANALYSIS
GrubHub
01/03/19 03:59:31 PMby Stella Osoba, CMT
GrubHub, Inc. (GRUB) is the mobile and online platform company that allows people to order meals from numerous restaurants for pick-up and delivery. On September 14, 2018, its share price closed at a high of 146.11. Just over three months later, on December 24, 2018, the share price had plunged to close at a low of 67.84. Let's review the technicals to see if they can tell us if the worst is over for the stock.
Position: N/A
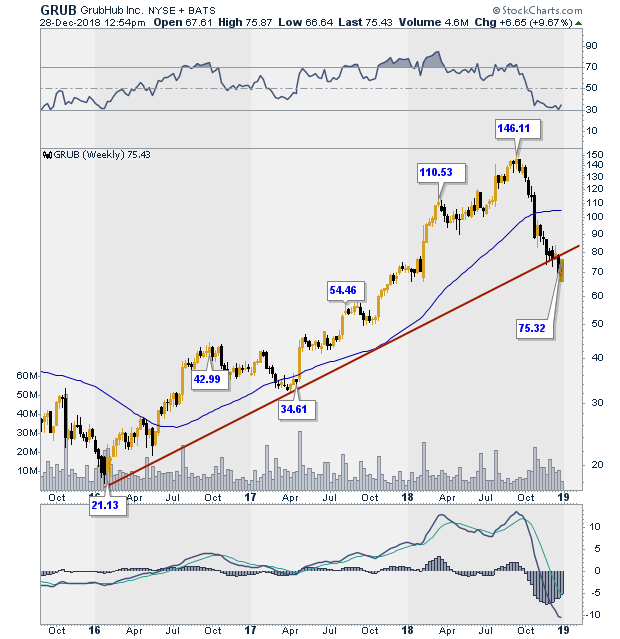
| Ever since February 2016 when GRUB was trading at around $20, the stock has been on a tear, notching increasing gains as it journeyed to a high of 146.11 in September 2018, or an increase of 530%. It seemed GRUB could do no wrong and Figure 1 tells the story of its impressive rise. However, history tells us that trees do not grow to the skies, what goes up will eventually come back down to earth. And with GRUB, when it did it was as painful as it was swift. In about 3 months, GRUB gave back 46% of its gains. |

|
| Figure 1. Weekly chart for GRUB. |
| Graphic provided by: StockCharts.com. |
| |
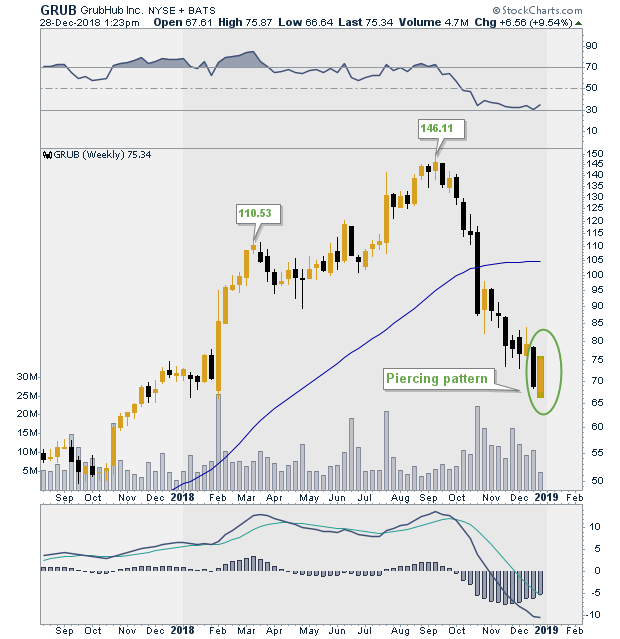
| When using technicals, your approach should ideally be to use a weight of the evidence approach. You want to find a preponderance of signals that support a bullish or bearish thesis. In this case we will look at Figure 2. The last two candlesticks have formed a piercing pattern. This is a bullish signal. The piercing pattern is a two candle formation that appears after a decline. The first candle is a black real body. The next candle should be a candle with a white real body that forms below the previous candle but closes within the body of that candle. Usually for the signal to be predictive, you want to see the second candle close at least half way up the first candle's body, but the more the second candle can "pierce" within the body of the first candle, the more bullish the signal. The pattern shows bulls overwhelming bears. |

|
| Figure 2. Weekly chart with bullish piercing candlestick pattern. |
| Graphic provided by: StockCharts.com. |
| |
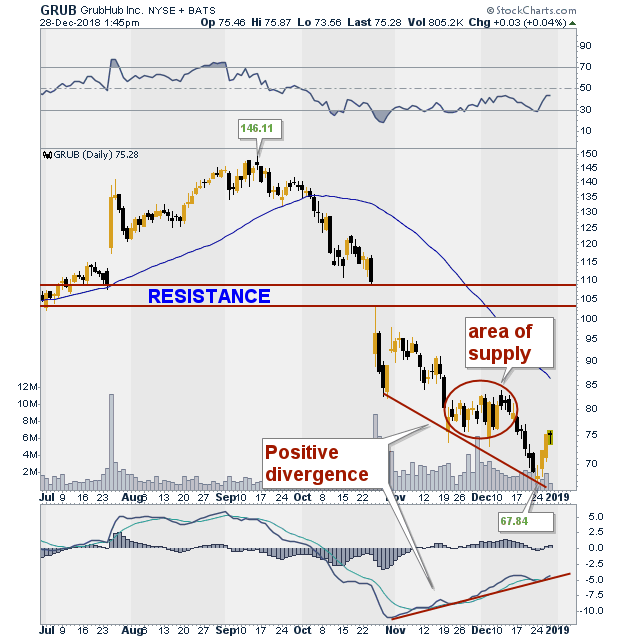
| Figure 3 is a daily chart showing the downtrend price action. Here we see that price has formed a positive divergence with the MACD, which is in the panel below price and also with RSI, which is in the panel above price, but not marked. A positive divergence happens when price is making lower lows, but the indicator is not. The MACD and RSI are both not confirming the continuing downtrend by making higher lows. Also, if you look carefully at the price chart, you will see that price has formed a morning star at the low, which is a bottom reversal pattern. The morning star pattern forms when after a downtrend, there is a long black candle. The next candle in this three candle pattern is a spinning top or candle with a small real body. The body of the spinning top must below and not within the body of the prior day's black real body. The final candle in the pattern on day three, is a bullish candle with a white real body that closes deeply into the body of the bearish candle of the first day. |

|
| Figure 3. Daily chart for GRUB. |
| Graphic provided by: StockCharts.com. |
| |
| Candles do not give price targets, so even though GRUB may be in for a bounce, there are obstacles which may hinder its progress. There is an area of supply which might cause any price rise to stall (See Figure 3). Also remember that the gap down is now an area of resistance. GRUB will need to close above the high of the area for the resistance area to be negated. This analysis is for educational purposes only. |
Stella Osoba is a trader and financial writer. She is a frequent contributor to "Technical Analysis of Stocks and Commodities" magazine and "Traders.com Advantage" as well as other financial publications.
| E-mail address: | stellaosoba@gmail.com |
Click here for more information about our publications!
PRINT THIS ARTICLE

Request Information From Our Sponsors
- StockCharts.com, Inc.
- Candle Patterns
- Candlestick Charting Explained
- Intermarket Technical Analysis
- John Murphy on Chart Analysis
- John Murphy's Chart Pattern Recognition
- John Murphy's Market Message
- MurphyExplainsMarketAnalysis-Intermarket Analysis
- MurphyExplainsMarketAnalysis-Visual Analysis
- StockCharts.com
- Technical Analysis of the Financial Markets
- The Visual Investor
- VectorVest, Inc.
- Executive Premier Workshop
- One-Day Options Course
- OptionsPro
- Retirement Income Workshop
- Sure-Fire Trading Systems (VectorVest, Inc.)
- Trading as a Business Workshop
- VectorVest 7 EOD
- VectorVest 7 RealTime/IntraDay
- VectorVest AutoTester
- VectorVest Educational Services
- VectorVest OnLine
- VectorVest Options Analyzer
- VectorVest ProGraphics v6.0
- VectorVest ProTrader 7
- VectorVest RealTime Derby Tool
- VectorVest Simulator
- VectorVest Variator
- VectorVest Watchdog
