HOT TOPICS LIST
- MACD
- Fibonacci
- RSI
- Gann
- ADXR
- Stochastics
- Volume
- Triangles
- Futures
- Cycles
- Volatility
- ZIGZAG
- MESA
- Retracement
- Aroon
INDICATORS LIST
LIST OF TOPICS
PRINT THIS ARTICLE
by Gary Grosschadl
This information technology player has enjoyed a huge run since its October bottom of $6 to a recent high of $11.50. Now it's showing a potential double top formation on its daily chart.
Position: Sell
Gary Grosschadl
Independent Canadian equities trader and technical analyst based in Peterborough
Ontario, Canada.
PRINT THIS ARTICLE
DOUBLE TOPS
Double Top For Unisys Corporation
12/19/02 11:49:31 AMby Gary Grosschadl
This information technology player has enjoyed a huge run since its October bottom of $6 to a recent high of $11.50. Now it's showing a potential double top formation on its daily chart.
Position: Sell
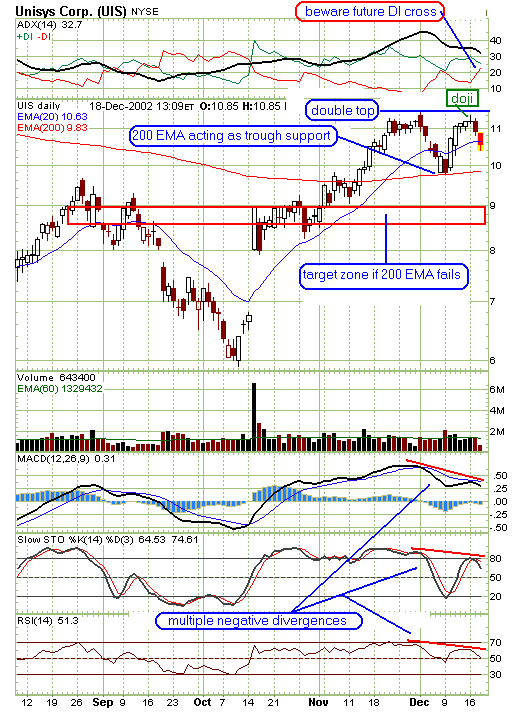
| This is a very interesting potential double top because of the location of the 200-day exponential moving average (EMA). This could turn out to be strong support at a critical level. Support here could negate the double top as this top formation needs to break under this trough support with conviction (high volume) to confirm the pattern. Measuring from the top to trough, there is a decline of about $1.50, indicating a possible move down to $8.50. |
| Giving credence and weight to the current decline are the doji candlestick at the second top and the multiple negative divergences shown on displayed indicators. Recall that a doji after a good run up often marks a coming reversal and this was aptly shown here in the very short term. An aggressive shorter seeing the doji coupled with the indicator negative divergences could have played an early double top failure move to test at least the 20-day EMA support line. Failure at this 20-day EMA could lead to the next moving average test, this being the important 200-day EMA, currently at $9.83. |

|
| Graphic provided by: StockCharts.com. |
| |
| A more patient and prudent trader will wait for the outcome of this trough test. Failure here on bigger volume would indicate the double top pattern's desire to complete this bearish formation. Note the target zone shown on the chart between $9 - $8.50. This encompasses previous congestion at $9, previous meaningful candle points, and the double top's measured decline. If it does come down this far, watch for signs of reversal to either cover short positions and/or enter new long positions. |
| The directional movement indicator shown at the top of the chart bears watching. A refusal of the DI lines to cross (as previously) is a bullish sign. If they do cross, this confirms further bearish action as the bulls lose further control leading to additional downside. A surprise close above the 20-day EMA (currently at $10.63) line negates this bearish sentiment and the double top. |
Independent Canadian equities trader and technical analyst based in Peterborough
Ontario, Canada.
| Website: | www.whatsonsale.ca/financial.html |
| E-mail address: | gwg7@sympatico.ca |
Click here for more information about our publications!
Comments
Date: 12/21/02Rank: 4Comment:
Date: 12/29/02Rank: 5Comment:

|

Request Information From Our Sponsors
- StockCharts.com, Inc.
- Candle Patterns
- Candlestick Charting Explained
- Intermarket Technical Analysis
- John Murphy on Chart Analysis
- John Murphy's Chart Pattern Recognition
- John Murphy's Market Message
- MurphyExplainsMarketAnalysis-Intermarket Analysis
- MurphyExplainsMarketAnalysis-Visual Analysis
- StockCharts.com
- Technical Analysis of the Financial Markets
- The Visual Investor
- VectorVest, Inc.
- Executive Premier Workshop
- One-Day Options Course
- OptionsPro
- Retirement Income Workshop
- Sure-Fire Trading Systems (VectorVest, Inc.)
- Trading as a Business Workshop
- VectorVest 7 EOD
- VectorVest 7 RealTime/IntraDay
- VectorVest AutoTester
- VectorVest Educational Services
- VectorVest OnLine
- VectorVest Options Analyzer
- VectorVest ProGraphics v6.0
- VectorVest ProTrader 7
- VectorVest RealTime Derby Tool
- VectorVest Simulator
- VectorVest Variator
- VectorVest Watchdog
