HOT TOPICS LIST
- MACD
- Fibonacci
- RSI
- Gann
- ADXR
- Stochastics
- Volume
- Triangles
- Futures
- Cycles
- Volatility
- ZIGZAG
- MESA
- Retracement
- Aroon
INDICATORS LIST
LIST OF TOPICS
PRINT THIS ARTICLE
by Taylor Ireland
A look at recent price action for West Texas Intermediate Crude Oil (WTI).
Position: N/A
Taylor Ireland
Sharedata Futures, Inc. provides historical data mining and visualization for the benchmark NYMEX Energy Futures Markets.
Sharedata combines structural analysis of the market generated data, dynamic systems analysis, and Bayesian causal inference techniques favored by the scientific and intelligence communities to provide a robust framework for addressing the uncertainty and risk in energy pricing.
PRINT THIS ARTICLE
TECHNICAL ANALYSIS
WTI Daily December 17
12/20/18 12:48:09 PMby Taylor Ireland
A look at recent price action for West Texas Intermediate Crude Oil (WTI).
Position: N/A
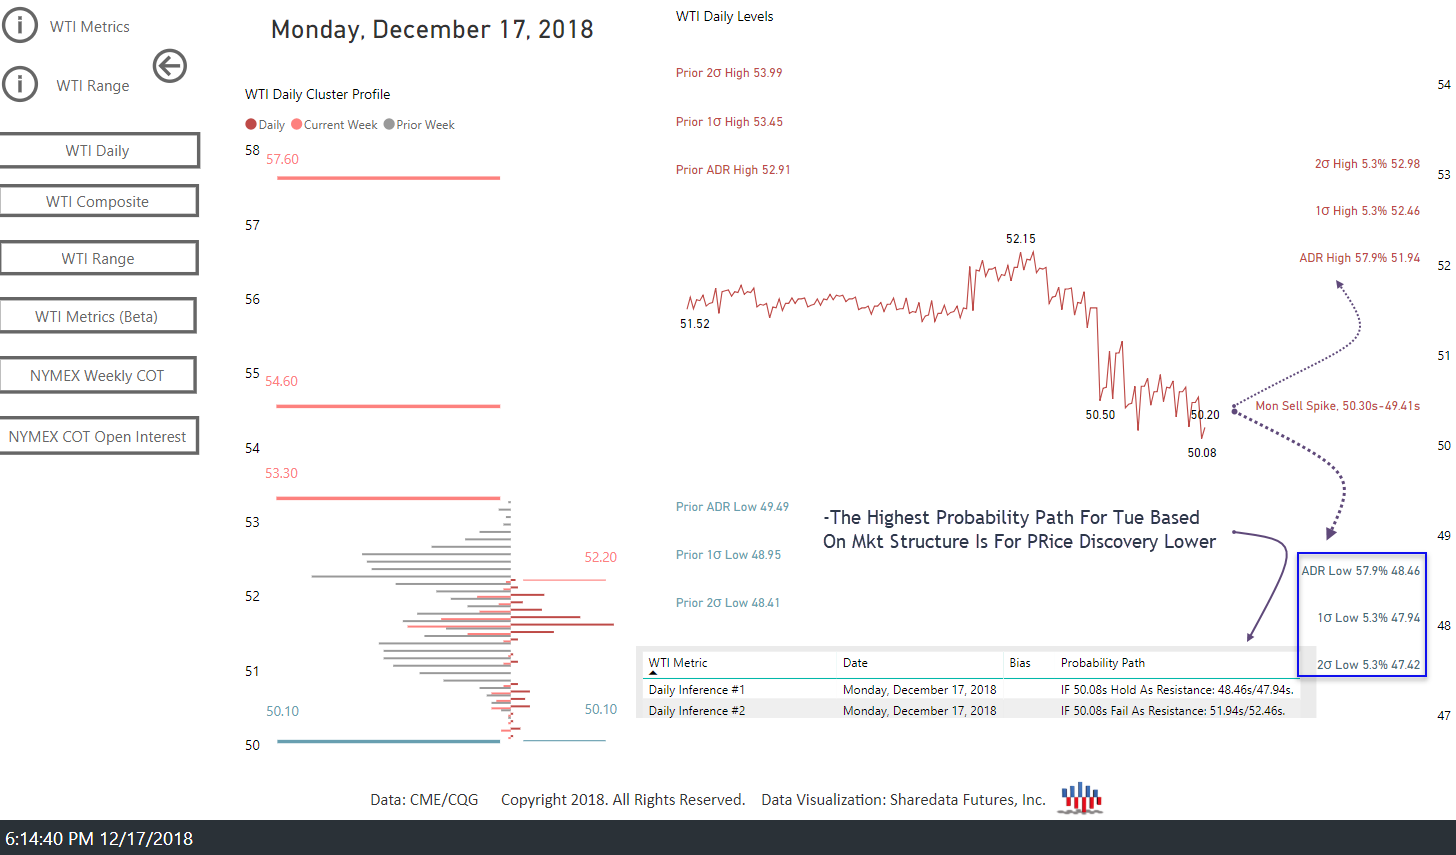
| As noted in Monday's WTI Daily (Figure 1), the highest probability path based on market structure for Tuesday's auction was for price discovery lower. Monday's structural sell spike, 50.30s-40.41s, that developed into the NY close held as resistance during Tuesday's Globex auction as price discovery lower to 48.13s developed into Tuesday's London auction. Retracement higher to 48.60s into the NY open saw selling interest emerge, defending the London high before price discovery lower ultimately developed to 47.27s at/near Sharedata's daily 2nd standard deviation low target. |

|
| Figure 1. WTI Analysis from Sharedata Futures. (right-click and open in a new tab to enlarge) |
| Graphic provided by: Sharedata Futures. |
| |
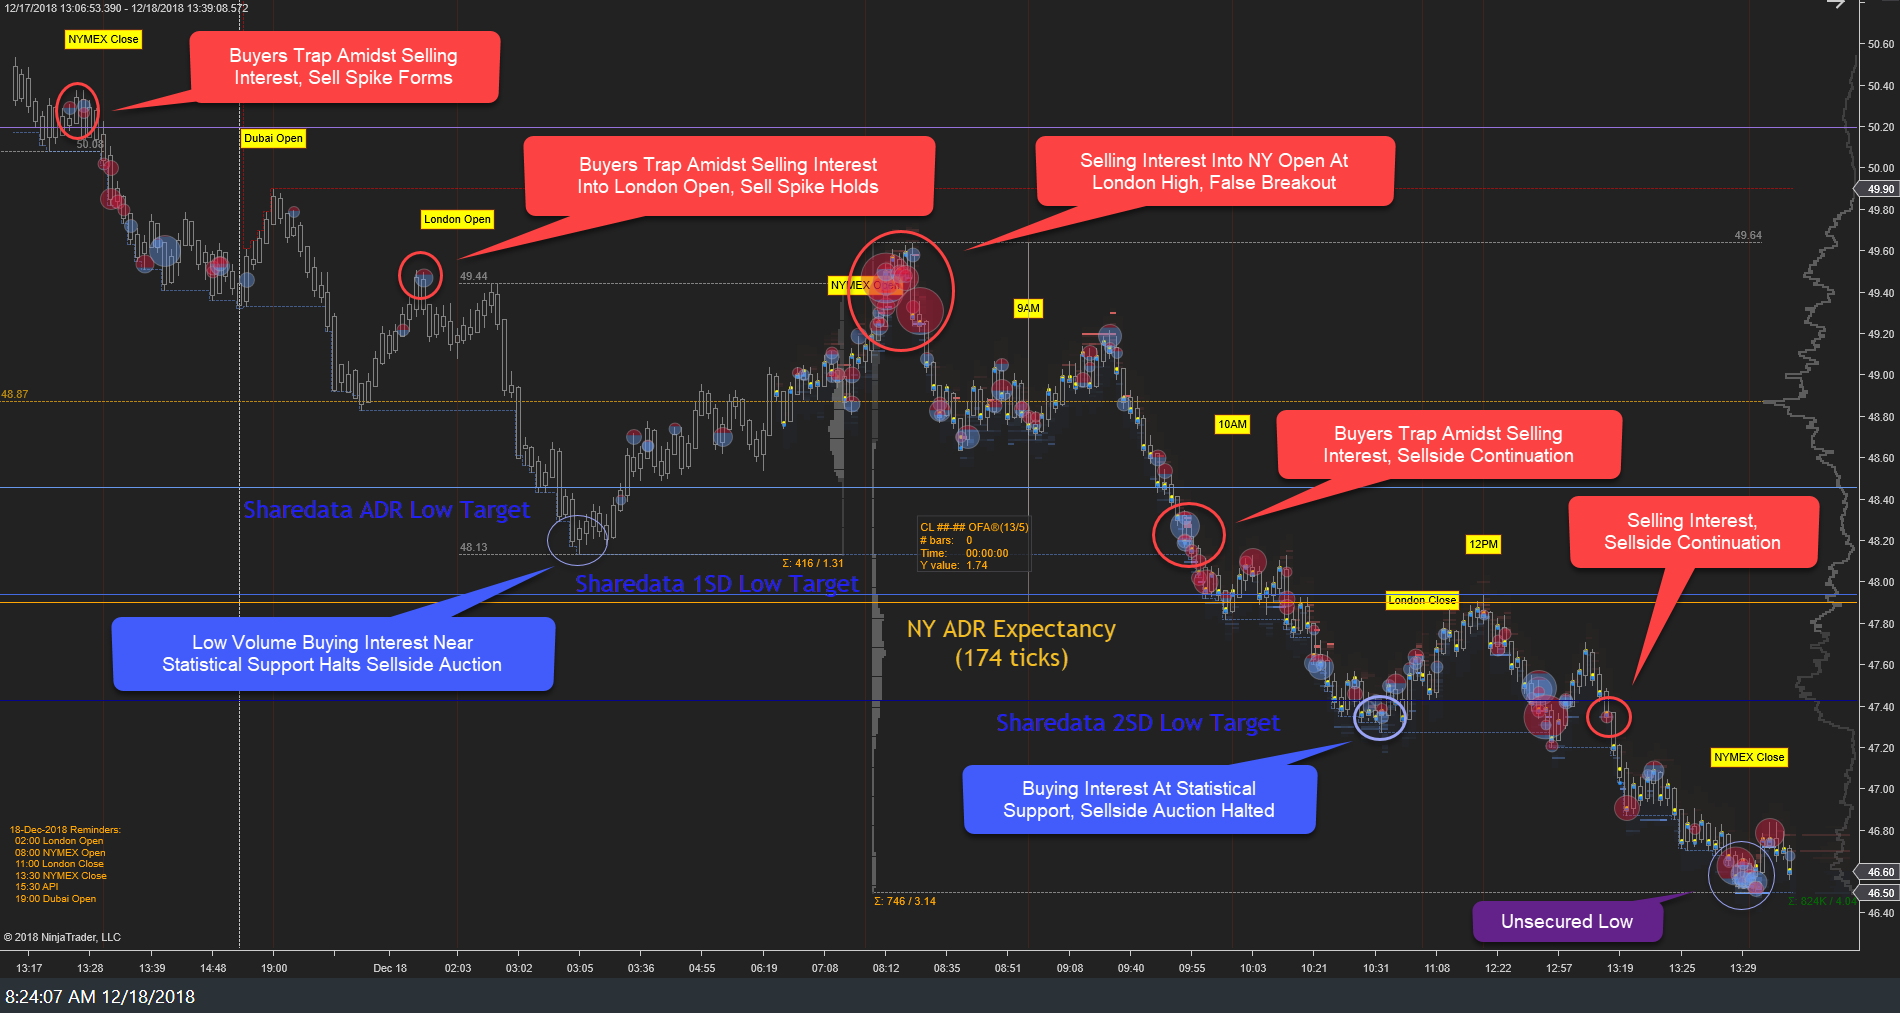
| Tuesday's auction saw price discovery lower during Globex from Monday's settlement, as the structural sell-spike, 50.30s-49.41s, held as resistance. Structural sell-spikes are evident in the market profile distribution and indicate a sort of unresolved market excess. When a spike holds, price continuation in the direction of the spike is the highest probability path. As Monday's sell spike held as resistance, price discovery lower developed into London, achieving a stopping point, 48.13s. Low volume buying interest halted the auction, rejecting the London low, forming a London buying tail, 48.13s-48.49s. Price discovery higher then developed toward 49.20s into the NY open as the market structure indicated a potential stopping point low. Price discovery higher developed early in NY, achieving the stopping point high, 49.64s, as a breakout attempt above the London high developed. Selling interest emerged there in large size, 49.58s-49.47s, as rotation lower back to challenge the Globex low, 48.13s, developed. Initiative selling entered, 48.15s-48.10s, as buyers trapped, driving price lower in sell-side continuation, achieving a stopping point, 47.27s, near Sharedata's daily 2nd standard deviation low target into the London close. Buying interest emerged there halting the sell-side auction, developing balance, 47.30s-47.95s. Rotation back to test the stopping point developed late in the NY auction as initiative selling interest emerged, 47.35s, driving price lower in further sell-side continuation, achieving an unsecured low, 46.50s, into the NY close, settling at 46.60s. |

|
| Figure 2. Price chart for Monday, December 17, 2018. (right-click and open in a new tab to enlarge) |
| Graphic provided by: NinjaTrader. |
| |
| Looking ahead, Tuesday's sell-side breach of major structural support, 50s-49.41s, implies a new sell-side directional phase has begun following the multi-week balance development from late November through mid-December 2018. Major structural supports below reside at $45/bbl and $39/bbl respectively. The near-term bias (2-4 week) is now sell-side barring new buy-side structure and order flow developments. |
Sharedata Futures, Inc. provides historical data mining and visualization for the benchmark NYMEX Energy Futures Markets.
Sharedata combines structural analysis of the market generated data, dynamic systems analysis, and Bayesian causal inference techniques favored by the scientific and intelligence communities to provide a robust framework for addressing the uncertainty and risk in energy pricing.
| Title: | Founder |
| Company: | Sharedata Futures, Inc. |
| Dallas, TX | |
| Website: | www.sdfanalytics.com |
| E-mail address: | support@sdfanalytics.com |
Traders' Resource Links | |
| Sharedata Futures, Inc. has not added any product or service information to TRADERS' RESOURCE. | |
Click here for more information about our publications!
PRINT THIS ARTICLE

Request Information From Our Sponsors
- StockCharts.com, Inc.
- Candle Patterns
- Candlestick Charting Explained
- Intermarket Technical Analysis
- John Murphy on Chart Analysis
- John Murphy's Chart Pattern Recognition
- John Murphy's Market Message
- MurphyExplainsMarketAnalysis-Intermarket Analysis
- MurphyExplainsMarketAnalysis-Visual Analysis
- StockCharts.com
- Technical Analysis of the Financial Markets
- The Visual Investor
- VectorVest, Inc.
- Executive Premier Workshop
- One-Day Options Course
- OptionsPro
- Retirement Income Workshop
- Sure-Fire Trading Systems (VectorVest, Inc.)
- Trading as a Business Workshop
- VectorVest 7 EOD
- VectorVest 7 RealTime/IntraDay
- VectorVest AutoTester
- VectorVest Educational Services
- VectorVest OnLine
- VectorVest Options Analyzer
- VectorVest ProGraphics v6.0
- VectorVest ProTrader 7
- VectorVest RealTime Derby Tool
- VectorVest Simulator
- VectorVest Variator
- VectorVest Watchdog
