

HOT TOPICS LIST
- MACD
- Fibonacci
- RSI
- Gann
- ADXR
- Stochastics
- Volume
- Triangles
- Futures
- Cycles
- Volatility
- ZIGZAG
- MESA
- Retracement
- Aroon
INDICATORS LIST
LIST OF TOPICS
PRINT THIS ARTICLE
by Stella Osoba, CMT
So Federal Express (FDX) announced its third quarter earnings on Tuesday, December 18, 2018 after market close and its shares tanked. Many reasons were given for this; some said it was because the company had announced weakness in its international business, or that it reduced its earnings guidance for 2019, or that it was a result of bad political decisions around the world impacting its bottom line. The technician knows that the reasons or the why's do not matter, because everything is in the charts.
Position: N/A
Stella Osoba, CMT
Stella Osoba is a trader and financial writer. She is a frequent contributor to "Technical Analysis of Stocks and Commodities" magazine and "Traders.com Advantage" as well as other financial publications.
PRINT THIS ARTICLE
TECHNICAL ANALYSIS
Finding Tops
12/27/18 01:25:28 PMby Stella Osoba, CMT
So Federal Express (FDX) announced its third quarter earnings on Tuesday, December 18, 2018 after market close and its shares tanked. Many reasons were given for this; some said it was because the company had announced weakness in its international business, or that it reduced its earnings guidance for 2019, or that it was a result of bad political decisions around the world impacting its bottom line. The technician knows that the reasons or the why's do not matter, because everything is in the charts.
Position: N/A
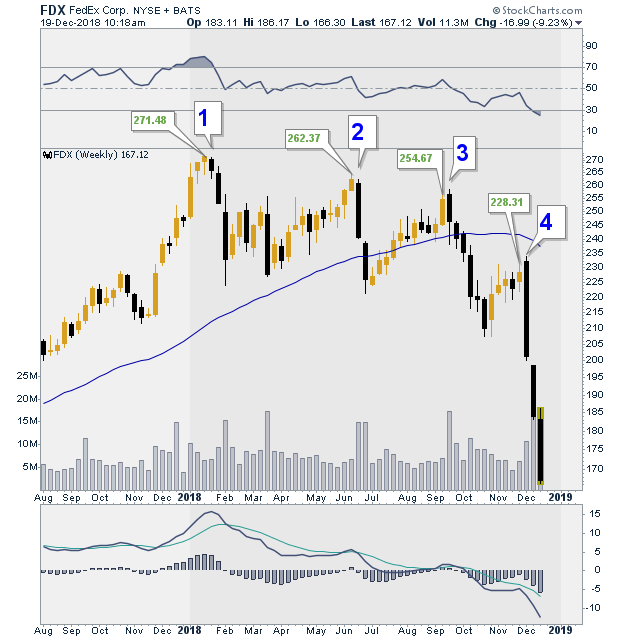
| A glance at the weekly chart on FDX will show that the decline was clear (See Figure 1). The high was reached in January 2018 and since then FDX made clearly discernible lower highs on the weekly chart. It was obviously in a down trend when it failed its tests of previous highs at points 1, 2, 3 and 4. But we all know that hindsight is 20/20. What is not so easy is being able to see these patterns in real time and take the right action. |
|
| Figure 1. A sign of trouble? FedEx daily chart making new lower highs. |
| Graphic provided by: StockCharts.com. |
| |
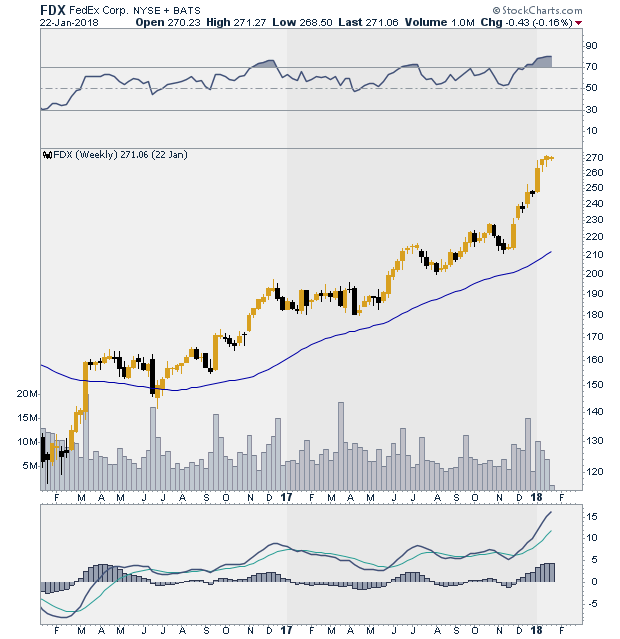
| When we look at charts, we usually let what has happened in the near past inform our decisions on what is likely to happen in the future. Conservatism bias is the tendency we have to insufficiently revise our previously formed opinions when presented with new information. Figure 2 clearly shows FDX in a strong uptrend. It has crossed its 50-day moving average and is making higher highs and higher lows. It is climbing nicely, all is well. As humans it is natural to expect the near past to resemble the near future, what has happened is likely to continue to happen. Therefore we allow ourselves to be lulled into a false sense of security. We stop being analytical, stop watching for signs of trouble. Fail to remember that trees do not grow to the skies. This is the reason why when the first signs of weakness start to happen, it is easy to dismiss because our opinions have already been formed that FDX is in a strong uptrend. |
|
| Figure 2. FedEx weekly chart in uptrend. |
| Graphic provided by: StockCharts.com. |
| |
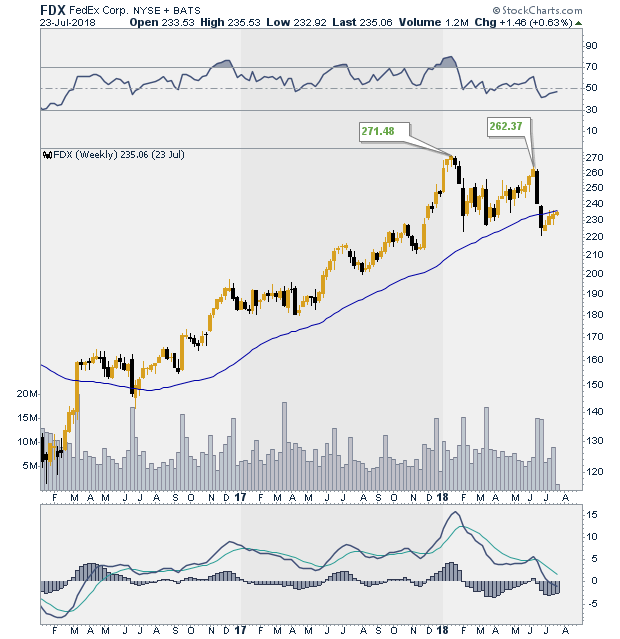
| Figure 3 is the same chart as Figure 2, but it is advanced by about six months. The decline that we see can easily be dismissed as a natural reaction in a strong uptrend. Maybe it is. But what should we be looking for to realize that this analysis is wrong? A successful test of the highs. So far each reaction has been met with a higher high. Will that happen this time? This is when we need to put on our skeptical hats and watch price action with the studiousness of a scientist studying microbial changes in a laboratory. |
|
| Figure 3. FedEx weekly chart's first sign of trouble. |
| Graphic provided by: StockCharts.com. |
| |
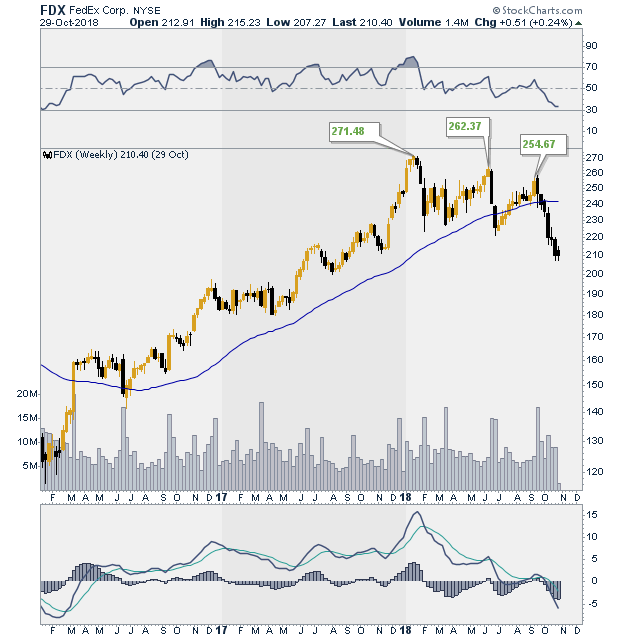
| The high in January 2018 was not tested until June 2018. Enough time for the average person to lose interest in the position, to get distracted, to feel wrong or confused and get out of the trade. But the test came, as it was surely going to, and the fact that price could not rise above the highs made in January spoke volumes. FDX had failed a test of its previous high. This coming after a near two year strong uptrend was an important signal. Figure 4 shows a a further failure of the test of the prior highs. Was this enough confirmation of prior signals? |
|
| Figure 4. Time to get out. FedEx weekly chart with successive lower highs. |
| Graphic provided by: StockCharts.com. |
| |
| Looking back at the strong uptrend that FDX had been in, maybe you did not want to accept that the uptrend was over. Maybe you thought the stock was trading sideways and would resume the uptrend. Maybe you did not think shorting the stock would be the next profitable trade, after all, the pundits were talking about how strong the stock market was. Even the President was bragging about how the strong stock market reflected well on him and his policies. But as technicians we should not be paying attention to noise. The charts, patience, discipline and self trust were all the tools we needed. By September 2018 when FDX failed its second test of market highs, it was time to throw in the towel and go short even though the DJIA was still making higher highs. |
Stella Osoba is a trader and financial writer. She is a frequent contributor to "Technical Analysis of Stocks and Commodities" magazine and "Traders.com Advantage" as well as other financial publications.
| E-mail address: | stellaosoba@gmail.com |
Click here for more information about our publications!
Comments

Request Information From Our Sponsors
- VectorVest, Inc.
- Executive Premier Workshop
- One-Day Options Course
- OptionsPro
- Retirement Income Workshop
- Sure-Fire Trading Systems (VectorVest, Inc.)
- Trading as a Business Workshop
- VectorVest 7 EOD
- VectorVest 7 RealTime/IntraDay
- VectorVest AutoTester
- VectorVest Educational Services
- VectorVest OnLine
- VectorVest Options Analyzer
- VectorVest ProGraphics v6.0
- VectorVest ProTrader 7
- VectorVest RealTime Derby Tool
- VectorVest Simulator
- VectorVest Variator
- VectorVest Watchdog
- StockCharts.com, Inc.
- Candle Patterns
- Candlestick Charting Explained
- Intermarket Technical Analysis
- John Murphy on Chart Analysis
- John Murphy's Chart Pattern Recognition
- John Murphy's Market Message
- MurphyExplainsMarketAnalysis-Intermarket Analysis
- MurphyExplainsMarketAnalysis-Visual Analysis
- StockCharts.com
- Technical Analysis of the Financial Markets
- The Visual Investor