

HOT TOPICS LIST
- MACD
- Fibonacci
- RSI
- Gann
- ADXR
- Stochastics
- Volume
- Triangles
- Futures
- Cycles
- Volatility
- ZIGZAG
- MESA
- Retracement
- Aroon
INDICATORS LIST
LIST OF TOPICS
PRINT THIS ARTICLE
by Stella Osoba, CMT
Kylie Jenner, the social media maverick with over 250 million followers, looks set to become one of the youngest billionaires in U.S. history. Ulta Beauty, Inc. (ULTA) has helped in no small way to amplify her fortunes. This is because with 970 stores spread across over 48 states and the District of Columbia, ULTA has helped take the eponymous make up brand mainstream.
Position: N/A
Stella Osoba, CMT
Stella Osoba is a trader and financial writer. She is a frequent contributor to "Technical Analysis of Stocks and Commodities" magazine and "Traders.com Advantage" as well as other financial publications.
PRINT THIS ARTICLE
TECHNICAL ANALYSIS
The Story Is In The Charts Not The News
12/20/18 12:36:02 PMby Stella Osoba, CMT
Kylie Jenner, the social media maverick with over 250 million followers, looks set to become one of the youngest billionaires in U.S. history. Ulta Beauty, Inc. (ULTA) has helped in no small way to amplify her fortunes. This is because with 970 stores spread across over 48 states and the District of Columbia, ULTA has helped take the eponymous make up brand mainstream.
Position: N/A
| At Ulta's investor day in October 2018, the company raised its outlook for store expansion from 1,400 stores to 1,700 stores. Apart from its brick and mortar stores, ULTA also has a strong e-commerce presence. With this rapid expansion, what do the technicals say about the short to midterm fortunes of the stock price? |
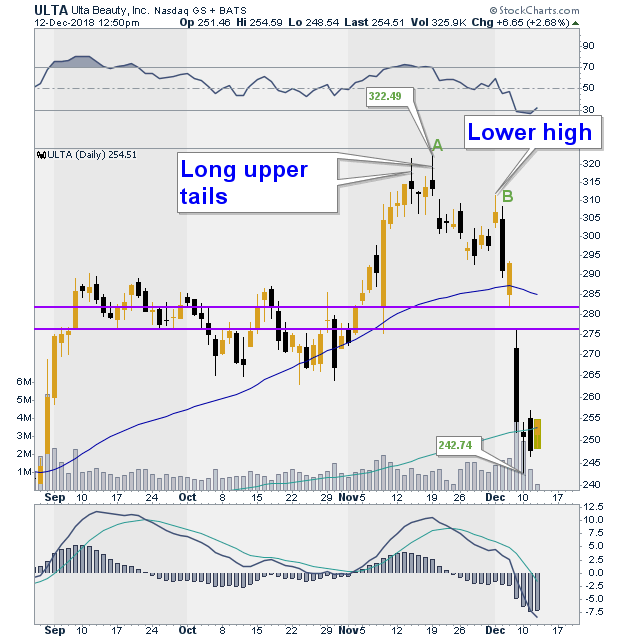
| Kylie may be doing well, but investors may not be faring quite as well. A glance at Figure 1 shows that from a high of 322.49 reached on November 19, 2018, ULTA plunged to close at a low of 242.74 on December 10, 2018. The 25% fall puts the stock in what many will call bear market territory. A bear market is often defined as a drop of 20% or more from price highs. A close look at the chart shows that for chart watchers, the candlesticks may have given some early warnings of the coming decline in price. Candles on November 14 and November 19, 2018 showed long upper tails, which coming after strong price rises is bearish. After the reaction at B, the next price high on December 3, 2018 also shows a candle forming with a long upper tail at the high of the move. This move up came in lower than the preceding high at A. |
|
| Figure 1. ULTA Daily Chart. |
| Graphic provided by: StockCharts.com. |
| |
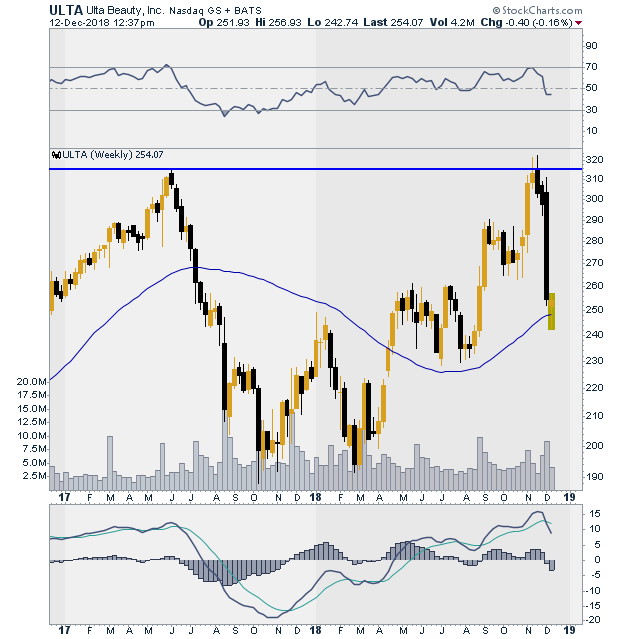
| A look at Figure 2 shows that the price high in November 2018 was even more significant than it appeared in Figure 1 because over a year ago in June 2017, price had touched those same levels, but retreated afterwards. This meant that the November high was a test of the prior highs in June 2017. The test ultimately proved to be unsuccessful, marking the November highs as a major resistance level. |
|
| Figure 2. ULTA Weekly Chart. |
| Graphic provided by: StockCharts.com. |
| |
| Price subsequently had a nose bleed decline, gapping down in the process. We can mark the area of the gap as new resistance (See Figure 1). The gap is marked by the two purple parallel lines. Price is now trading below its 50-day moving average. It has recently dipped below the 200-day moving average but looks to be trying to close above it. |
| So let's review the evidence so far. We have a stock that is trading firmly in bear market territory. It has failed a test of a previous significant area of resistance. It is currently trading below its 50-day moving average and has dipped below its 200-day moving average. Is there any good news in sight? The seeds of the next move of any security or index are always buried in its current move. We know that ULTA is currently trading in a downtrend. But downtrends will have reactions to the upside. Important areas to watch are the 200-day moving average, the 50-day moving average and the ability of price to trade above the falling window. Then a reassessment of the position will be in order. |
Stella Osoba is a trader and financial writer. She is a frequent contributor to "Technical Analysis of Stocks and Commodities" magazine and "Traders.com Advantage" as well as other financial publications.
| E-mail address: | stellaosoba@gmail.com |
Click here for more information about our publications!
Comments
Date:�12/21/18Rank:�5Comment:�

Request Information From Our Sponsors
- StockCharts.com, Inc.
- Candle Patterns
- Candlestick Charting Explained
- Intermarket Technical Analysis
- John Murphy on Chart Analysis
- John Murphy's Chart Pattern Recognition
- John Murphy's Market Message
- MurphyExplainsMarketAnalysis-Intermarket Analysis
- MurphyExplainsMarketAnalysis-Visual Analysis
- StockCharts.com
- Technical Analysis of the Financial Markets
- The Visual Investor
- VectorVest, Inc.
- Executive Premier Workshop
- One-Day Options Course
- OptionsPro
- Retirement Income Workshop
- Sure-Fire Trading Systems (VectorVest, Inc.)
- Trading as a Business Workshop
- VectorVest 7 EOD
- VectorVest 7 RealTime/IntraDay
- VectorVest AutoTester
- VectorVest Educational Services
- VectorVest OnLine
- VectorVest Options Analyzer
- VectorVest ProGraphics v6.0
- VectorVest ProTrader 7
- VectorVest RealTime Derby Tool
- VectorVest Simulator
- VectorVest Variator
- VectorVest Watchdog