HOT TOPICS LIST
- MACD
- Fibonacci
- RSI
- Gann
- ADXR
- Stochastics
- Volume
- Triangles
- Futures
- Cycles
- Volatility
- ZIGZAG
- MESA
- Retracement
- Aroon
INDICATORS LIST
LIST OF TOPICS
PRINT THIS ARTICLE
by Stella Osoba, CMT
After the market plunge on December 4, 2018 when the DOW fell 799 points, the S&P 500 gave up 90 points, and the Nasdaq plunged 283 points, Lam Research Corp. (LRCX) was one of the 10 worst performing stocks in the Nasdaq 100.
Position: N/A
Stella Osoba, CMT
Stella Osoba is a trader and financial writer. She is a frequent contributor to "Technical Analysis of Stocks and Commodities" magazine and "Traders.com Advantage" as well as other financial publications.
PRINT THIS ARTICLE
TECHNICAL ANALYSIS
LAM
12/13/18 05:49:17 PMby Stella Osoba, CMT
After the market plunge on December 4, 2018 when the DOW fell 799 points, the S&P 500 gave up 90 points, and the Nasdaq plunged 283 points, Lam Research Corp. (LRCX) was one of the 10 worst performing stocks in the Nasdaq 100.
Position: N/A
| LRCX was in a downtrend months before the recent market rout. In fact, since March 13, 2018, when it touched a high of 230.42, LRCX has given back roughly 31% of its price. This puts the stock firmly in bear market territory. This analysis seeks to determine whether to expect more downside, or if the green shoots of a short term reaction are on the cards. |

|
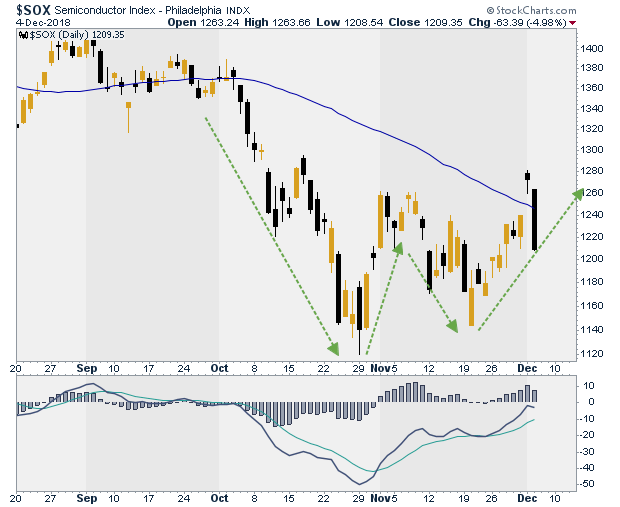
| Figure 1. Daily chart of the Semiconductor Index. |
| Graphic provided by: StockCharts.com. |
| |
| LRCX is a component of the semiconductor index (SOX). A look at Figure 1 shows that price has recently formed a W pattern. As opposed to price patterns forming an M, W's can be bottom reversals if other conditions are in place. So if a short term reversal might be in store for the semiconductor index, how likely is it that LRCX joins in the upswing? |

|
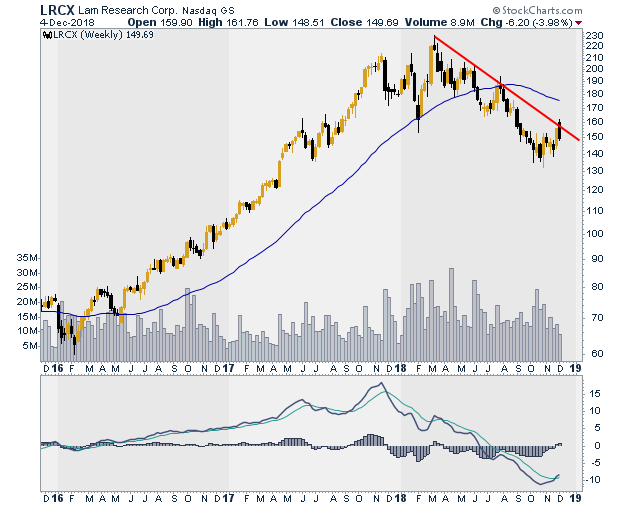
| Figure 2. Daily chart for LRCX. |
| Graphic provided by: StockCharts.com. |
| |
| Figure 2, which is a weekly chart, shows the intermediate term downward sloping trend line of LRCX. We can see that LRCX recently broke above its downward trend line, but it did not close above it. The chart also shows that during the week of July 30, 2018, LRCX also broke above the downward sloping trend line, but did not succeed in closing above it then either. |

|
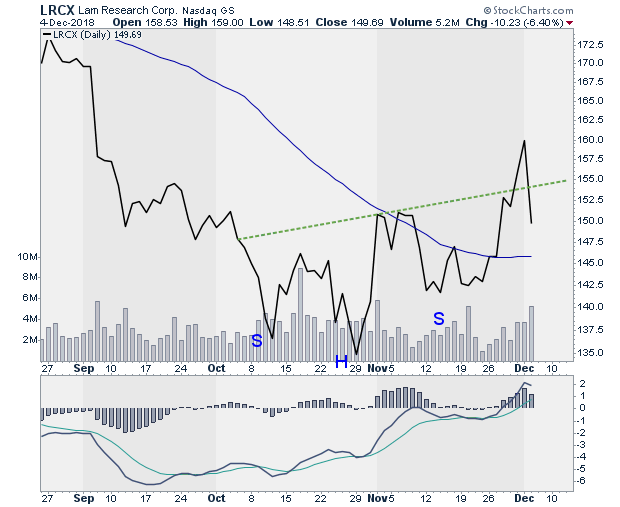
| Figure 3. Daily line chart for LCRX showing inverse head and shoulder pattern. |
| Graphic provided by: StockCharts.com. |
| |
| Technical analysis takes a preponderance of evidence approach to analyze signals and determine near term price action. Figure 3 shows a line chart of LRCX. The line chart allows us to more easily see the price pattern. We can see that LRCX formed a complex inverse head and shoulder pattern marked on the chart. The inverse head and shoulders pattern is a bottom reversal pattern. The signal for a trade, usually happens when price breaks above the neckline, which is the green dotted line. We can see that even though price broke above the neckline, it also slipped back below it. This negates the earlier entry signal which would have been long on a break above the neckline. |
| The severe plunge in the Nasdaq on December 4, 2018 is not to be ignored. It is technically damaging for the general market and also many individual stocks. So the best strategy would be to wait and see what happens next. The failure of patterns like the inverse head and shoulders can give a strong signal for a trade in the reverse direction, which in this case would be a short. So if price continues to go lower and closes below the right shoulder and also the head, then the pattern should be seen as a continuation and not a reversal. Patience is the best strategy in this and many other cases. Let price show you what it is going to do before deciding on a trade. |
Stella Osoba is a trader and financial writer. She is a frequent contributor to "Technical Analysis of Stocks and Commodities" magazine and "Traders.com Advantage" as well as other financial publications.
| E-mail address: | stellaosoba@gmail.com |
Click here for more information about our publications!
PRINT THIS ARTICLE

Request Information From Our Sponsors
- StockCharts.com, Inc.
- Candle Patterns
- Candlestick Charting Explained
- Intermarket Technical Analysis
- John Murphy on Chart Analysis
- John Murphy's Chart Pattern Recognition
- John Murphy's Market Message
- MurphyExplainsMarketAnalysis-Intermarket Analysis
- MurphyExplainsMarketAnalysis-Visual Analysis
- StockCharts.com
- Technical Analysis of the Financial Markets
- The Visual Investor
- VectorVest, Inc.
- Executive Premier Workshop
- One-Day Options Course
- OptionsPro
- Retirement Income Workshop
- Sure-Fire Trading Systems (VectorVest, Inc.)
- Trading as a Business Workshop
- VectorVest 7 EOD
- VectorVest 7 RealTime/IntraDay
- VectorVest AutoTester
- VectorVest Educational Services
- VectorVest OnLine
- VectorVest Options Analyzer
- VectorVest ProGraphics v6.0
- VectorVest ProTrader 7
- VectorVest RealTime Derby Tool
- VectorVest Simulator
- VectorVest Variator
- VectorVest Watchdog
