HOT TOPICS LIST
- MACD
- Fibonacci
- RSI
- Gann
- ADXR
- Stochastics
- Volume
- Triangles
- Futures
- Cycles
- Volatility
- ZIGZAG
- MESA
- Retracement
- Aroon
INDICATORS LIST
LIST OF TOPICS
PRINT THIS ARTICLE
by Mark Rivest
See how the strongest stock market sectors perform in bull and bear markets.
Position: N/A
Mark Rivest
Independent investment advisor, trader and writer. He has written articles for Technical Analysis of Stocks & Commodities, Traders.com Advantage,Futuresmag.com and, Finance Magnates. Author of website Four Dimension Trading.
PRINT THIS ARTICLE
SECTOR INVESTING
Stock Market Sector Analysis
12/13/18 05:39:10 PMby Mark Rivest
See how the strongest stock market sectors perform in bull and bear markets.
Position: N/A
| Some stock market analysts believe that during bear markets, proper stock selection can reduce portfolio losses. A study of sectors within the US stock market sheds light on that theory. US Stock Market Sectors First, a definition of what is a strong sector. For purpose of this article, strong is a sector that keeps rallying after the S&P 500 (SPX) has reached a major or intermediate peak. State Street Global Advisors have nine sector Exchange Traded Funds (ETF) that cover most of the US stock market. The SPX made a major top in October of 2007 (10/07), and an intermediate top in May of 2015 (5/15); these are the bench marks to judge sector performance. The sector funds and performances are as follows.
There are only two sectors that rallied beyond both the SPX 10/07 top and the 5/15 top; Health Care - XLV and Consumer Staples - XLP. This is logical because these sectors deliver "must have" goods and services. | ||||||||||||||||||||||||||||||||||||||||

| ||||||||||||||||||||||||||||||||||||||||
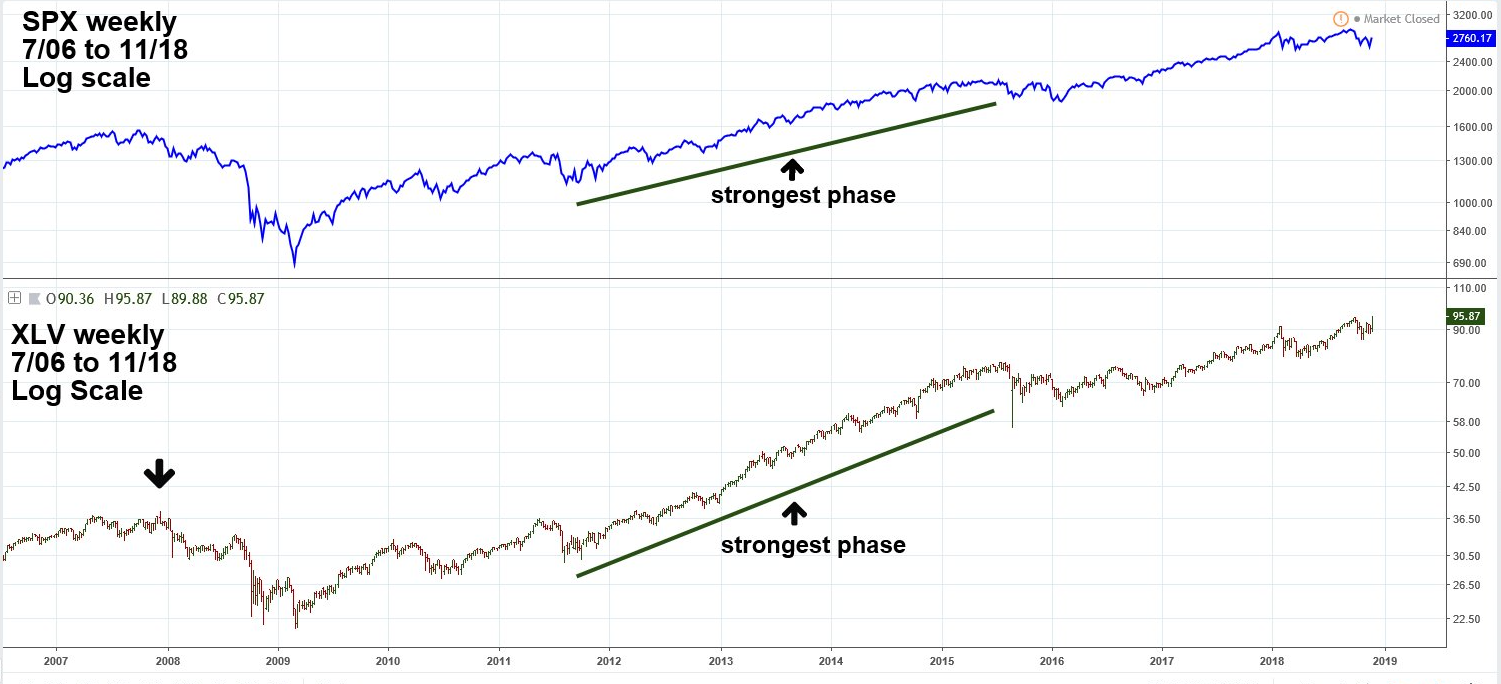
| Figure 1. At the intermediate bottom made February 2016 XLV was down 19.1% from its 2015 peak while the SPX declined 15.2%. | ||||||||||||||||||||||||||||||||||||||||
| Graphic provided by: tradingview.com. | ||||||||||||||||||||||||||||||||||||||||
| | ||||||||||||||||||||||||||||||||||||||||
| Health Care Sector Please see the XLV and SPX weekly chart illustrated in Figure 1. The XLV topped in December 2007, two months after the SPX peak and then followed the broader market until the major low made in March of 2009. At the major bottom, XLV had suffered a 42.9% loss vs. the SPX 57.6% loss. Yes, XLV held up better than the SPX. However, down 42.9% is a Pyrrhic victory. In 2015 XLV topped two months after the SPX intermediate peak. The top in 2015 is important because It concludes the strongest part of the bull market that began in 2009. The August 2015 mini crash occurred shortly after XLV topped. On August 24 many ETFs had wild and very brief declines, so it's better to judge the XLV performance based upon the bottom it made in February 2016. At the intermediate bottom made February 2016, XLV was down 19.1% from its 2015 peak while the SPX declined 15.2%. | ||||||||||||||||||||||||||||||||||||||||

| ||||||||||||||||||||||||||||||||||||||||
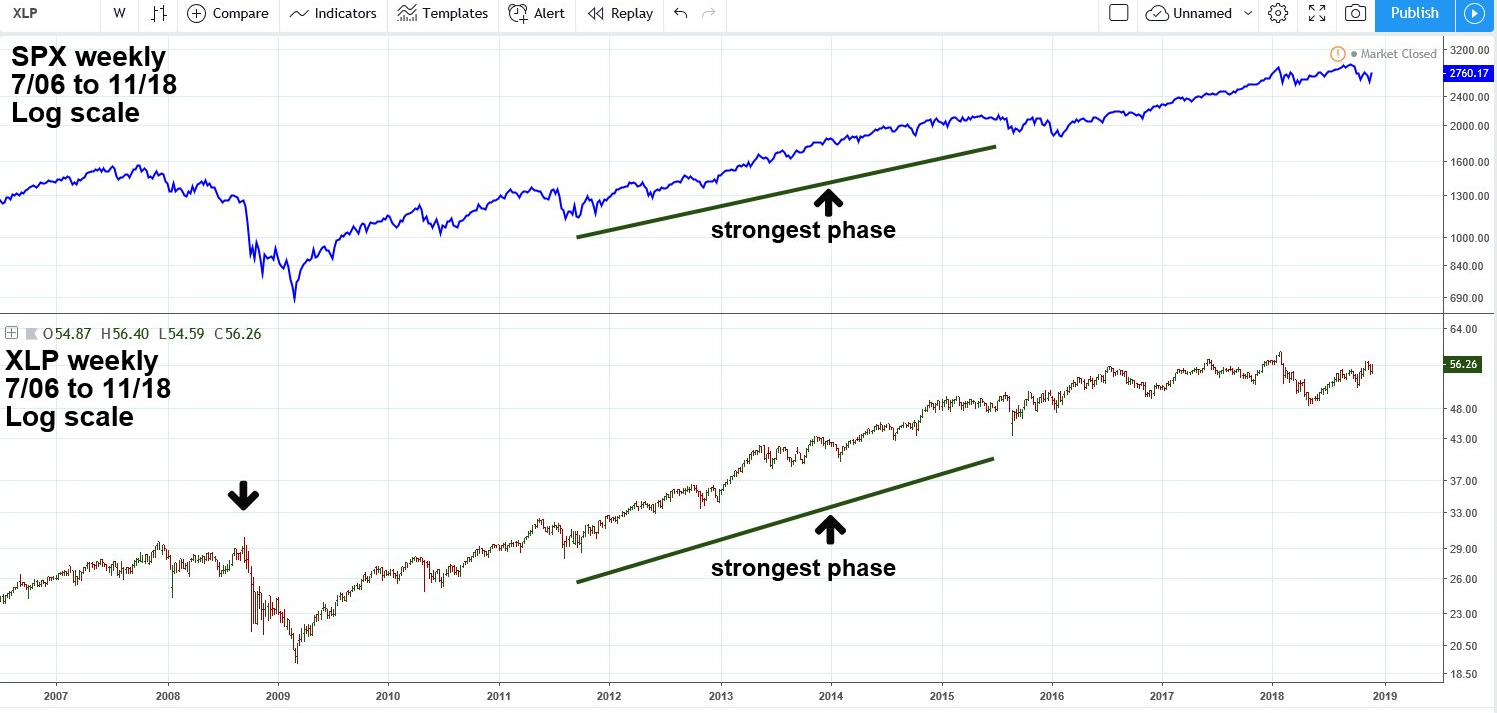
| Figure 2. The XLP was able to make a new high an incredible eleven months after the SPX major top in October of 2007. | ||||||||||||||||||||||||||||||||||||||||
| Graphic provided by: tradingview.com. | ||||||||||||||||||||||||||||||||||||||||
| | ||||||||||||||||||||||||||||||||||||||||
| Consumer Staples Sector Please see the XLP and SPX weekly chart illustrated in Figure 2. The XLP was able to make a new high an incredible eleven months after the SPX major top in October of 2007. The ETF was not able to resist the worst part of the 2007-2009 bear market. Immediately after the XLP top in 2008 it began a very sharp decline. At the major bottom in March 2009, XLP was down 36.3% vs. the SPX drop of 57.6%. The XLP held up better than XLV. However, I suspect those traders/investors that decided to ride out the decline would have preferred to miss the ride. In 2015 the XLP again was the last sector to top, culminating its bull run in August just a few days before the mini crash. Ignoring the wild and very brief activity on August 24, the lowest point for XLP came on August 25, down only 10.4%. When the SPX final correction low was made in February 2016, XLP was down just 4% vs. SPX down 15.2%. For the 2015-2016 correction, holding XLP made sense. Later in 2016 the XLP was uncharacteristically weaker than the broader stock market. From July to November 2016 XLP had declined 10.7%. Then January to April 2018 XLP fell 17.2%. Both instances the declines were probably triggered by a rise in interest rates. Because of the very low interest rate following the 2007-2008 recession, high dividend paying Consumer Staple companies stocks became proxies for low yielding bonds. At the time of the XLP 2016 and 2018 declines it would be logical to assume that a very strong sector's weakness vs. the broader market was a sign of a coming bear market. The late 2016 XLP drop turned out to be a false signal. So far, it's not clear if the 2018 XLP decline is a clue to a developing bear market. | ||||||||||||||||||||||||||||||||||||||||
| Summary Occasionally you'll hear or read of a market advisor recommending allocation into certain stock sectors. If the allocation is to avoid or reduce potential bear market losses it probably won't work. Allocation out of the stock market into money market funds is the best method to avoiding stock market losses. Holding a stock or a fund and enduring a 30 to 50% decline is not acceptable. Have a plan to reduce positions if there are negative returns. Know how much you are willing to lose before entering a position and where the liquidation points are located. An alternative to liquidation is hedging either with Put options or Inverse stock market ETF's. Buy and hold of even the strongest sectors in most cases will not avoid devastating losses, and it could take many months, or years, to recover. | ||||||||||||||||||||||||||||||||||||||||
Independent investment advisor, trader and writer. He has written articles for Technical Analysis of Stocks & Commodities, Traders.com Advantage,Futuresmag.com and, Finance Magnates. Author of website Four Dimension Trading.
| Website: | www.fourdimensiontrading.com |
| E-mail address: | markrivest@gmail.com |
Click here for more information about our publications!
PRINT THIS ARTICLE

Request Information From Our Sponsors
- VectorVest, Inc.
- Executive Premier Workshop
- One-Day Options Course
- OptionsPro
- Retirement Income Workshop
- Sure-Fire Trading Systems (VectorVest, Inc.)
- Trading as a Business Workshop
- VectorVest 7 EOD
- VectorVest 7 RealTime/IntraDay
- VectorVest AutoTester
- VectorVest Educational Services
- VectorVest OnLine
- VectorVest Options Analyzer
- VectorVest ProGraphics v6.0
- VectorVest ProTrader 7
- VectorVest RealTime Derby Tool
- VectorVest Simulator
- VectorVest Variator
- VectorVest Watchdog
- StockCharts.com, Inc.
- Candle Patterns
- Candlestick Charting Explained
- Intermarket Technical Analysis
- John Murphy on Chart Analysis
- John Murphy's Chart Pattern Recognition
- John Murphy's Market Message
- MurphyExplainsMarketAnalysis-Intermarket Analysis
- MurphyExplainsMarketAnalysis-Visual Analysis
- StockCharts.com
- Technical Analysis of the Financial Markets
- The Visual Investor
