HOT TOPICS LIST
- MACD
- Fibonacci
- RSI
- Gann
- ADXR
- Stochastics
- Volume
- Triangles
- Futures
- Cycles
- Volatility
- ZIGZAG
- MESA
- Retracement
- Aroon
INDICATORS LIST
LIST OF TOPICS
PRINT THIS ARTICLE
by Fawad Razaqzada
A false breakout - or a fakeout - is when price momentarily moves above a previous high or below a previous low, but then goes back within the existing range. This happens when there isn't enough demand above the old high, or enough supply beneath the prior low to help push price significantly in the direction of the break.
Position: N/A
Fawad Razaqzada
Fawad Razaqzada is an experienced analyst and economist having been involved in the financial markets since 2010 working for leading global FX and CFD brokerages. Having graduated with a degree in economics and leveraging years of financial market experience, Fawad provides retail and professional traders worldwide with succinct fundamental & technical analysis. In addition, he also offers premium trade signals to subscribers, and trading education to help shorten the learning curves of developing traders. He has also been trading on his personal account for many years. Follow Fawad on twitter @Trader_F_R or visit his website at TradingCandles.com.
PRINT THIS ARTICLE
FALSE MOVES
Trading The False Break Effectively
12/04/18 02:55:44 PMby Fawad Razaqzada
A false breakout - or a fakeout - is when price momentarily moves above a previous high or below a previous low, but then goes back within the existing range. This happens when there isn't enough demand above the old high, or enough supply beneath the prior low to help push price significantly in the direction of the break.
Position: N/A
| When a breakout fails, it shows that the move is basically exhausted, and the rejection alone could provide significant reward if traded correctly. Being able to identify such setups may not only lead to better trading opportunities but could potentially help you cut your losing trades quicker if you happen to be one of those breakout traders that has been trapped. Below are a few examples of false break formations, so that hopefully you can spot them and benefit from such patterns in the future. |

|
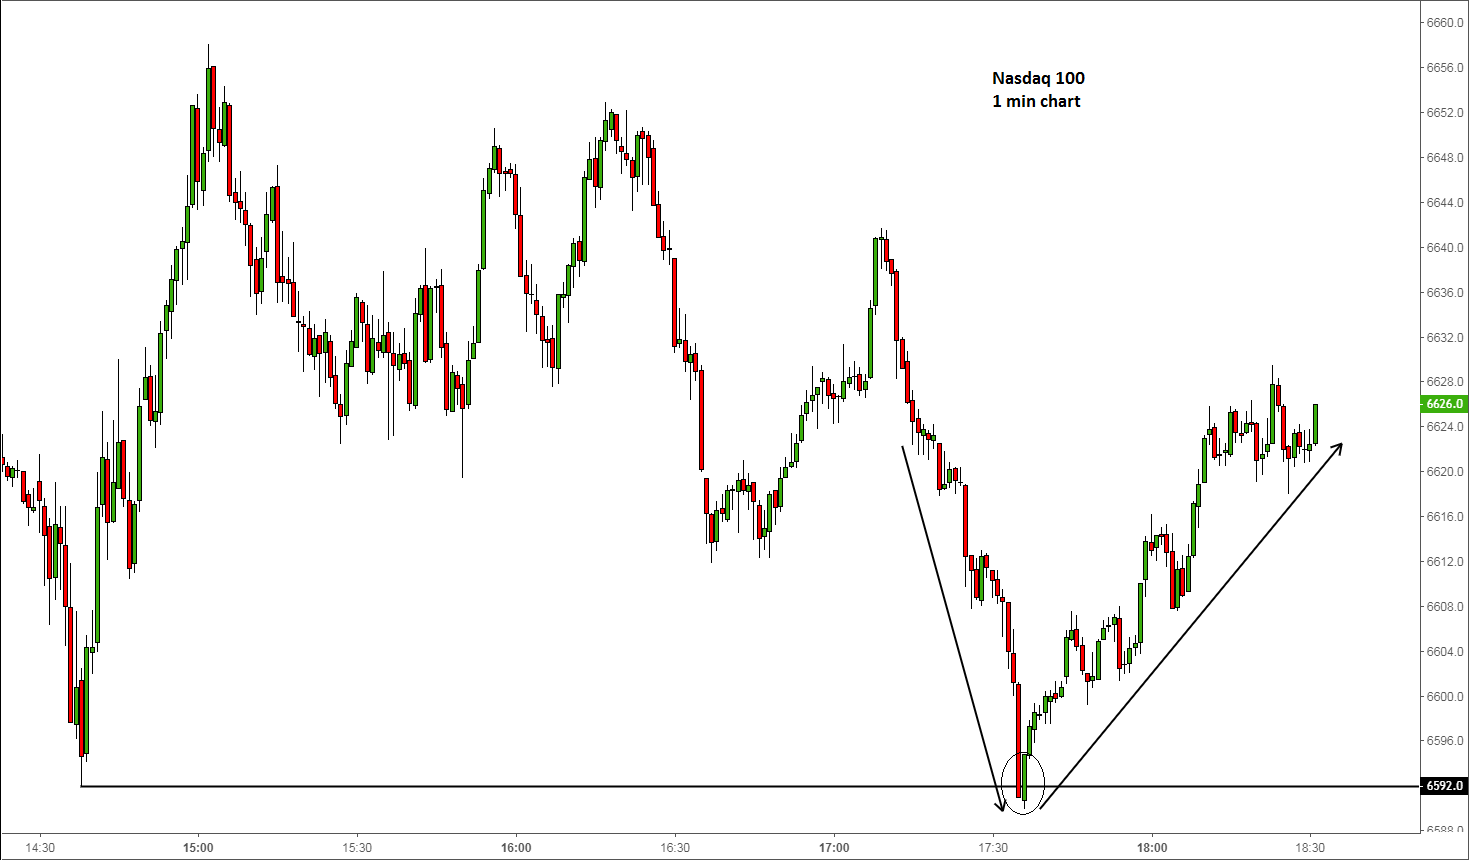
| Figure 1. Nasdaq 100 1-minute chart. |
| Graphic provided by: Tradingview.com. |
| |
| False breaks can happen on any time frame. Generally speaking, the higher the time frame, the better the quality of the setup tends to be. But even on the 1-minute chart, such as in this example of the Nasdaq 100 (Figure 1), the markets can form false break reversal patterns. The 6590-6595 area had been a key short-term pivotal zone on the higher time frames, so the sharp 65-point jump off the 6592 level just after the cash market had opened made perfect technical sense. But when the market came back down again, notice the accelerated downward move just prior to the quick rejection. This is where a lot of newer traders get into trouble: selling right into support as the FOMO kicks in. The reason the index fell sharply there was undoubtedly because of the cluster of sell stop orders that were resting below the 6592 level. Some of these may have been the stop loss orders from those that had bought around 6592 earlier in the day (who had then tightened their stops to just beneath 6592 as price moved higher, in order to reduce their risk), while the rest of these sell stops may have been from breakout traders who, anticipating a breakdown of the support, had placed their entry orders just below this low (which is a typical rookie mistake, by the way). In any case, the point I am making is that the liquidity here (i.e. that cluster of sell stop orders) was used to fill what must have been a large buy order — which explains why the market rallied sharply afterwards, as demand outweighed supply. Once the index started to trade above the 6592 level, the idea here would have been to go long with a market order and place a tight stop loss beneath the most recent low. The potential reward from this type of a trade would have been huge. |

|
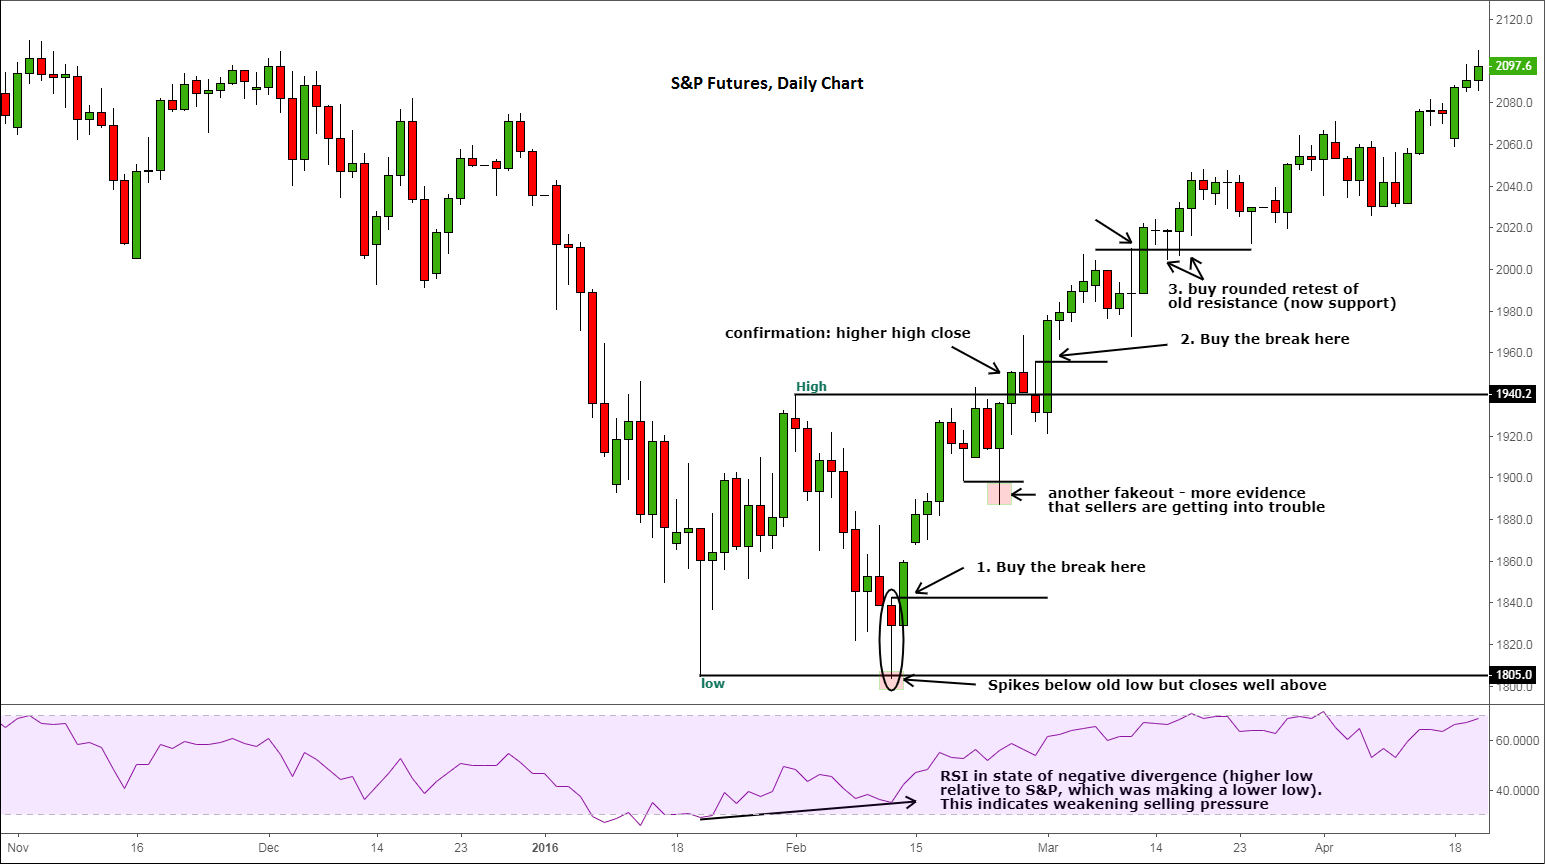
| Figure 2. S&P Futures daily chart. |
| Graphic provided by: Tradingview.com. |
| |
| False breaks can be traded so many different ways and on different time frames. In this example of the S&P 500 futures (Figure 2), I have highlighted at least three different areas to buy around, after a false break took place. Here, the S&P spiked below the old low at 1805 but the sellers couldn't hold their ground for too long. As the false break could have possibly been anticipated (given the magnitude of the drop and the RSI diverging positively), intraday traders could have potentially bought near the low, based on price action on a smaller time frame chart, such as the hourly or even the 1-minute as per the Nasdaq example above. But you don't necessarily need to buy near the low. The important point is that once a false break takes place — and there is a good reaction away from that level, thereby confirming the mismatch between supply and demand — usually the market goes in the other direction for several days, providing plenty of subsequent tradable opportunities. In this case, the follow-through that occurred on the day after the fakeout could have been a very nice breakout buying opportunity, as highlighted on the chart. But if you needed extra confirmation, the break above the old high at 1940 was just that: not only did the index form a false break reversal pattern, it went on to make a higher low. As the bullish trend is starting to emerge, traders can now utilize various entry techniques to get on-board, such as the entry examples I have highlighted on the chart. But it all started with that false break! |

|
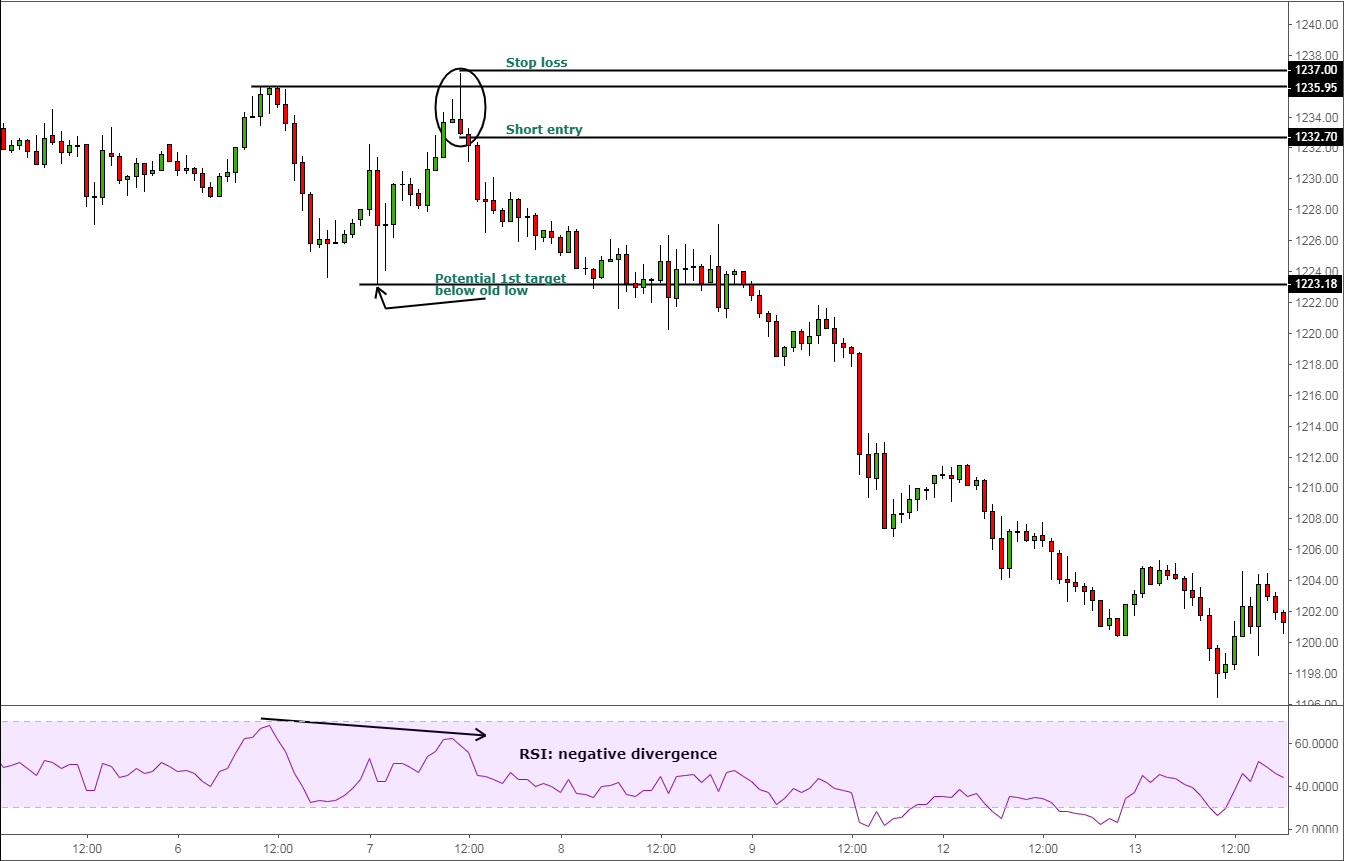
| Figure 3. Gold. |
| Graphic provided by: Tradingview.com. |
| |
| When it comes to intraday trading, the same logic applies: a temporary move above an old high or below an old low and a quick rejection. In this example (Figure 3), gold attempted to break above its old high at $1236, but the bulls' advance was quickly rejected after a brief break. The resulting price action was an inverted hammer (or shooting star) candlestick pattern on the hourly chart. Based on this, a potential short trade would have been to simply enter once the hourly candle closed. The stop loss would have been a tight one, placed just above this shooting star signal candle, and the main target could have been, for example, the liquidity pool below the old low at $1223 — where sell stops would be resting, some of which are used to fill your closing buy order(s). |
| In all the above examples, the common denominator behind these false breakout patterns was a sharp move into an old significant high or low. If price drifts towards the level, typically it will break through it. After all, the more distance price must travel to an old swing point, the more likely it will be hit by profit-taking and thereby increasing the likelihood of a rejection. The beauty of the false break setup is that sometimes price goes significantly in the opposite direction, hence the saying "from false moves come fast moves in the opposite direction." These trades normally have lopsided risk-to-reward profiles, allowing the trader to put on size behind the trade as the stop loss is typically very tight — especially if the fakeout setup is identified on the lower time frames relative to, for example, an entry off a daily or weekly chart. |
Fawad Razaqzada is an experienced analyst and economist having been involved in the financial markets since 2010 working for leading global FX and CFD brokerages. Having graduated with a degree in economics and leveraging years of financial market experience, Fawad provides retail and professional traders worldwide with succinct fundamental & technical analysis. In addition, he also offers premium trade signals to subscribers, and trading education to help shorten the learning curves of developing traders. He has also been trading on his personal account for many years. Follow Fawad on twitter @Trader_F_R or visit his website at TradingCandles.com.
| Title: | Financial Market Analyst |
| Company: | TradingCandles.com |
| London, | |
| Website: | tradingcandles.com |
| E-mail address: | fawad.razaqzada@hotmail.co.uk |
Traders' Resource Links | |
| TradingCandles.com has not added any product or service information to TRADERS' RESOURCE. | |
Click here for more information about our publications!
Comments
Date: 12/05/18Rank: 4Comment:

Request Information From Our Sponsors
- StockCharts.com, Inc.
- Candle Patterns
- Candlestick Charting Explained
- Intermarket Technical Analysis
- John Murphy on Chart Analysis
- John Murphy's Chart Pattern Recognition
- John Murphy's Market Message
- MurphyExplainsMarketAnalysis-Intermarket Analysis
- MurphyExplainsMarketAnalysis-Visual Analysis
- StockCharts.com
- Technical Analysis of the Financial Markets
- The Visual Investor
- VectorVest, Inc.
- Executive Premier Workshop
- One-Day Options Course
- OptionsPro
- Retirement Income Workshop
- Sure-Fire Trading Systems (VectorVest, Inc.)
- Trading as a Business Workshop
- VectorVest 7 EOD
- VectorVest 7 RealTime/IntraDay
- VectorVest AutoTester
- VectorVest Educational Services
- VectorVest OnLine
- VectorVest Options Analyzer
- VectorVest ProGraphics v6.0
- VectorVest ProTrader 7
- VectorVest RealTime Derby Tool
- VectorVest Simulator
- VectorVest Variator
- VectorVest Watchdog
