

HOT TOPICS LIST
- MACD
- Fibonacci
- RSI
- Gann
- ADXR
- Stochastics
- Volume
- Triangles
- Futures
- Cycles
- Volatility
- ZIGZAG
- MESA
- Retracement
- Aroon
INDICATORS LIST
LIST OF TOPICS
PRINT THIS ARTICLE
by Stella Osoba, CMT
The markets can be brutal and unforgiving places, which is why assuming you know what it will do next is often a recipe for a swift lesson in humility.
Position: N/A
Stella Osoba, CMT
Stella Osoba is a trader and financial writer. She is a frequent contributor to "Technical Analysis of Stocks and Commodities" magazine and "Traders.com Advantage" as well as other financial publications.
PRINT THIS ARTICLE
TECHNICAL ANALYSIS
Don't Assume You Know
11/29/18 02:50:53 PMby Stella Osoba, CMT
The markets can be brutal and unforgiving places, which is why assuming you know what it will do next is often a recipe for a swift lesson in humility.
Position: N/A
| Financial news abounds on the internet and elsewhere. Articles, blogs, opinion pieces and more penned by people with confident and convincing sounding forecasts of what the market will do next. They espouse on how high and how low prices will go. This leads the unwary to assume that predicting must be easy. So many times people take a position unaware that they have blinders on. They narrow their focus and make an assumption on what will happen next to an index or stock and then take a position based on that assumption. |
| Blinders are small squares of firm leather or cups attached to a horse's bridle or hood. Their purpose is to prevent the horse from seeing sideways or behind. The reason it is thought that some horses need them is that some horses can easily become distracted and therefore panic if they are able to use their peripheral vision. Many people trade with the focus of a horse that wears blinders. This is because they see their position so clearly, they fail to take into account, after entering into the trade, sometimes subtle signals that can hint at an alternative theory unfolding. |
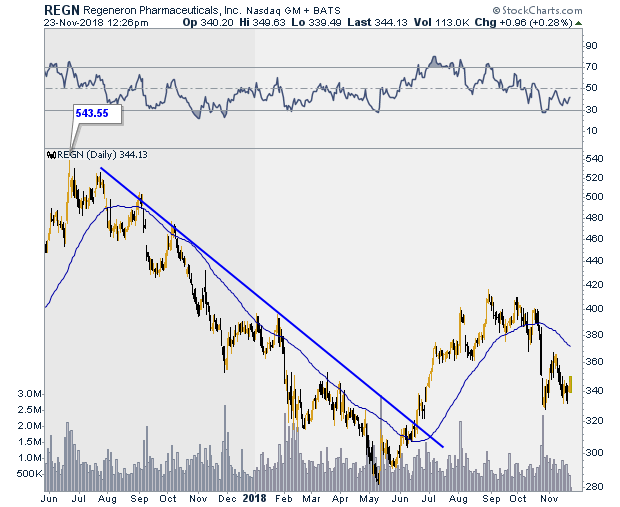
| Let us use the stock of Regeneron Pharmaceuticals, Inc (REGN) to illustrate the point (Figure 1). After reaching a high of 543.55 on June 22, 2017, REGN embarked on an unrelenting downtrend over the next 12 months, falling to a low of 281.89 on May 9, 2018. Suppose you had spotted the higher low it had made on May 29, 2018 and waited for the break to enter the trade on June 19, 2018, you would have seen price rise and accepted the happy circumstance that you had entered the trade very near the start of a trend reversal. Looking at historical charts of REGN (see Figure 1) it would be tempting to look for the trend to take price to test its highs of June 22, 2017. This assumption of what price would do, might lead you to trade with blinkers on. Let it run, you might think to yourself and therein lies the fatal assumption. |
|
| Figure 1. Daily chart for REGN. |
| Graphic provided by: StockCharts.com. |
| |
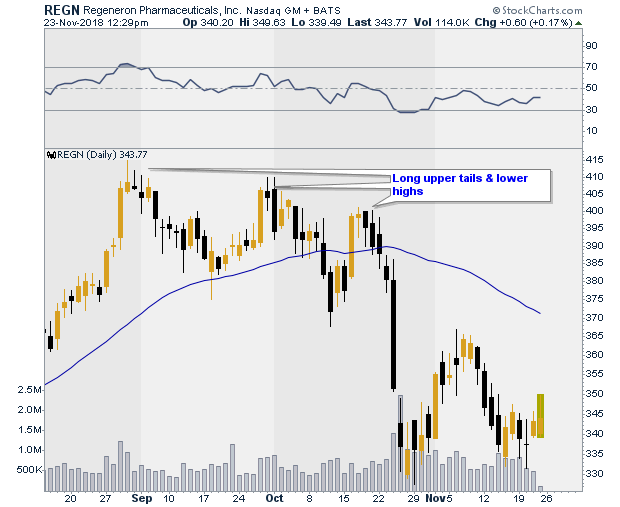
| The market or any individual stock will always do what it does, not what you think it should do. Therefore, it is only wise to expect to change your analysis at any time, even as soon as the day after entering the trade if the situation warrants. If trading on daily charts, each new candle gives you an opportunity to reassess the position. So what did price do? It touched a high of 416.39 on August 30, 2018, and from there lost its earlier momentum. |
|
| Figure 2. Lower highs and long upper tails provide warnings to exit long trades. |
| Graphic provided by: StockCharts.com. |
| |
| Many people would have held on to their longs, since their price targets were not met, hoping for a continuation of the earlier trend. Why would anyone have held on to a winning trade, that became a losing one? Because their assumptions had failed to alert them to the signals of the trend change. (See Figure 2). Candles with long upper tails, lower highs and negative divergence were all signals to warn us to exit longs or buy protection. |
Stella Osoba is a trader and financial writer. She is a frequent contributor to "Technical Analysis of Stocks and Commodities" magazine and "Traders.com Advantage" as well as other financial publications.
| E-mail address: | stellaosoba@gmail.com |
Click here for more information about our publications!
PRINT THIS ARTICLE

Request Information From Our Sponsors
- StockCharts.com, Inc.
- Candle Patterns
- Candlestick Charting Explained
- Intermarket Technical Analysis
- John Murphy on Chart Analysis
- John Murphy's Chart Pattern Recognition
- John Murphy's Market Message
- MurphyExplainsMarketAnalysis-Intermarket Analysis
- MurphyExplainsMarketAnalysis-Visual Analysis
- StockCharts.com
- Technical Analysis of the Financial Markets
- The Visual Investor
- VectorVest, Inc.
- Executive Premier Workshop
- One-Day Options Course
- OptionsPro
- Retirement Income Workshop
- Sure-Fire Trading Systems (VectorVest, Inc.)
- Trading as a Business Workshop
- VectorVest 7 EOD
- VectorVest 7 RealTime/IntraDay
- VectorVest AutoTester
- VectorVest Educational Services
- VectorVest OnLine
- VectorVest Options Analyzer
- VectorVest ProGraphics v6.0
- VectorVest ProTrader 7
- VectorVest RealTime Derby Tool
- VectorVest Simulator
- VectorVest Variator
- VectorVest Watchdog