HOT TOPICS LIST
- MACD
- Fibonacci
- RSI
- Gann
- ADXR
- Stochastics
- Volume
- Triangles
- Futures
- Cycles
- Volatility
- ZIGZAG
- MESA
- Retracement
- Aroon
INDICATORS LIST
LIST OF TOPICS
PRINT THIS ARTICLE
by Matt Blackman
Stormy seas tossed stock markets this fall, and were especially rough on market-leading tech stocks. And there are signs that the worst might not yet be over.
Position: N/A
Matt Blackman
Matt Blackman is a full-time technical and financial writer and trader. He produces corporate and financial newsletters, and assists clients in getting published in the mainstream media. Matt has earned the Chartered Market Technician (CMT) designation. Follow Matt on Twitter at www.twitter.com/RatioTrade
PRINT THIS ARTICLE
BULL/BEAR MARKET
Assessing the Fall FAANG Bite
11/29/18 02:44:00 PMby Matt Blackman
Stormy seas tossed stock markets this fall, and were especially rough on market-leading tech stocks. And there are signs that the worst might not yet be over.
Position: N/A
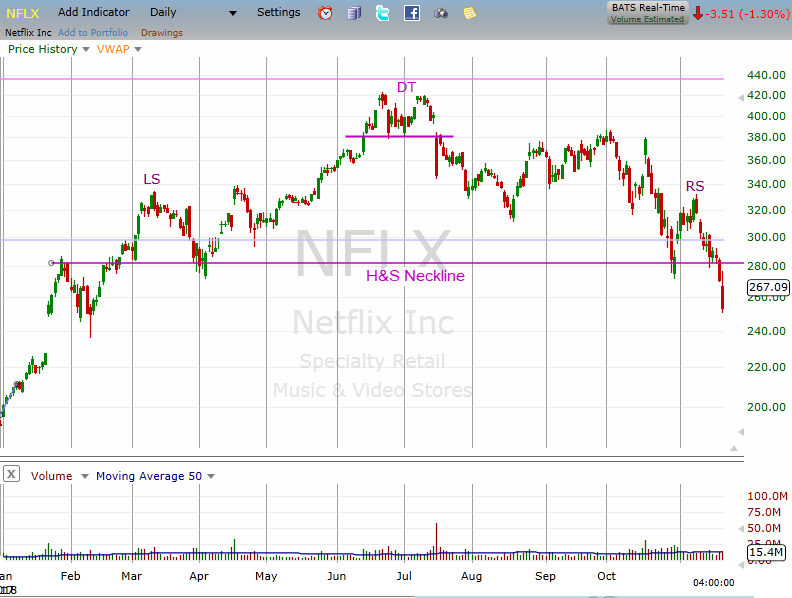
| In the first six months of 2018, stocks were propelled higher, led by a group of market-leading tech stocks. By far, the best performing of these FAANG stocks (Facebook, Apple, Amazon, Netflix and Google) was Netflix. But as spring turned to summer, NFLX posted the first signs of trouble — a bearish Double Top chart pattern that was confirmed with a gap down through the pattern neckline around 384 on more than five times average volume (see Figure 1). For the next five months, the stock then gave back most of what it had gained in the first part of the year. As the bitter November winds whipped markets, NFLX was driven back down to where it had been in February. |

|
| Figure 1. NFLX Daily Chart. |
| Graphic provided by: Freestockcharts.com. |
| |
| Traders that had obeyed the Double Top pattern warning and dutifully exited as the DT neckline around 384 was broken, had done a good job of preserving profits. Over the next four months, the stock put in the near mirror image of the first six plus months of the year. In October, NFLX had temporarily broken down below the Head & Shoulders neckline around 280 before breaking back above it. But then the stock had resumed its rapid slide, breaking back through the neckline again on above average volume as December approached. |

|
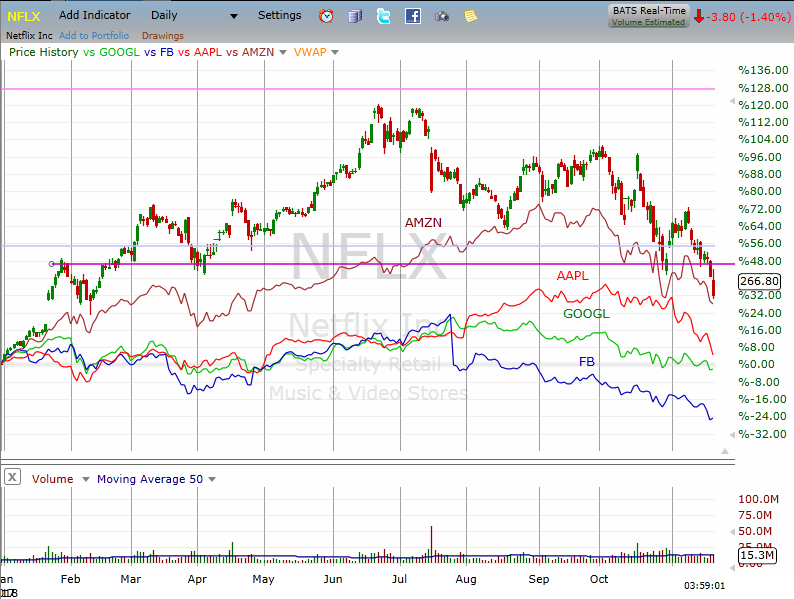
| Figure 2. Daily chart comparing the FAANG stocks. |
| Graphic provided by: Freestockcharts.com. |
| |
| And like NFLX, the other FAANG members had given back most, if not all, of the early-year gains. Facebook had been the worst hit losing 28% on the year by the third week of November. One of the first signs that the stock market is transitioning from rally to correction is that strongest performing rally leaders stop moving up then suffer greater percentage losses due to over-stretched valuations. If the correction is simply a much needed rest for stocks and economic conditions remain strong, the rally often resumes. But for that to happen, the bearish chart patterns, like the NFLX Head & Shoulders need to be invalidated on strong buying volume. But if the rally has instead run its course, the bear patterns then hold deflecting attempts to invalidate them as the correction gains traction. |
Matt Blackman is a full-time technical and financial writer and trader. He produces corporate and financial newsletters, and assists clients in getting published in the mainstream media. Matt has earned the Chartered Market Technician (CMT) designation. Follow Matt on Twitter at www.twitter.com/RatioTrade
| Title: | Author |
| Company: | TradeSystemGuru |
| Address: | Box 2589 |
| Garibaldi Highlands, BC V0N1T0 | |
| Phone # for sales: | 6048989069 |
| E-mail address: | indextradermb@gmail.com |
Traders' Resource Links | |
| TradeSystemGuru has not added any product or service information to TRADERS' RESOURCE. | |
Click here for more information about our publications!
PRINT THIS ARTICLE

Request Information From Our Sponsors
- StockCharts.com, Inc.
- Candle Patterns
- Candlestick Charting Explained
- Intermarket Technical Analysis
- John Murphy on Chart Analysis
- John Murphy's Chart Pattern Recognition
- John Murphy's Market Message
- MurphyExplainsMarketAnalysis-Intermarket Analysis
- MurphyExplainsMarketAnalysis-Visual Analysis
- StockCharts.com
- Technical Analysis of the Financial Markets
- The Visual Investor
- VectorVest, Inc.
- Executive Premier Workshop
- One-Day Options Course
- OptionsPro
- Retirement Income Workshop
- Sure-Fire Trading Systems (VectorVest, Inc.)
- Trading as a Business Workshop
- VectorVest 7 EOD
- VectorVest 7 RealTime/IntraDay
- VectorVest AutoTester
- VectorVest Educational Services
- VectorVest OnLine
- VectorVest Options Analyzer
- VectorVest ProGraphics v6.0
- VectorVest ProTrader 7
- VectorVest RealTime Derby Tool
- VectorVest Simulator
- VectorVest Variator
- VectorVest Watchdog
