HOT TOPICS LIST
- MACD
- Fibonacci
- RSI
- Gann
- ADXR
- Stochastics
- Volume
- Triangles
- Futures
- Cycles
- Volatility
- ZIGZAG
- MESA
- Retracement
- Aroon
INDICATORS LIST
LIST OF TOPICS
PRINT THIS ARTICLE
by Stella Osoba, CMT
General Electric (GE) has been in a painful downtrend for the last two years. In fact, its stock has fallen so sharply that on June 26, 2018, it was replaced by Walgreens (WBA) as a Dow component. That GE was an original member of the 30-company index and had been in the DOW continuously since 1907 only served to increase the significance of its decline. Now, a close at $7.99 on November 12, 2018 has some asking, is the worst over for this battered stock?
Position: N/A
Stella Osoba, CMT
Stella Osoba is a trader and financial writer. She is a frequent contributor to "Technical Analysis of Stocks and Commodities" magazine and "Traders.com Advantage" as well as other financial publications.
PRINT THIS ARTICLE
TECHNICAL ANALYSIS
Is the Worst Over?
11/20/18 10:10:55 AMby Stella Osoba, CMT
General Electric (GE) has been in a painful downtrend for the last two years. In fact, its stock has fallen so sharply that on June 26, 2018, it was replaced by Walgreens (WBA) as a Dow component. That GE was an original member of the 30-company index and had been in the DOW continuously since 1907 only served to increase the significance of its decline. Now, a close at $7.99 on November 12, 2018 has some asking, is the worst over for this battered stock?
Position: N/A
| GE's decline over the last 24 months has been a reminder that even storied stocks can get punished in the stock market. From a high of $30.62 on July 20, 2018, to a low of $7.99 on November 12, 2018, GE's 74% decline was like watching what perhaps had been a supernova under its maverick former CEO burn itself out. |

|
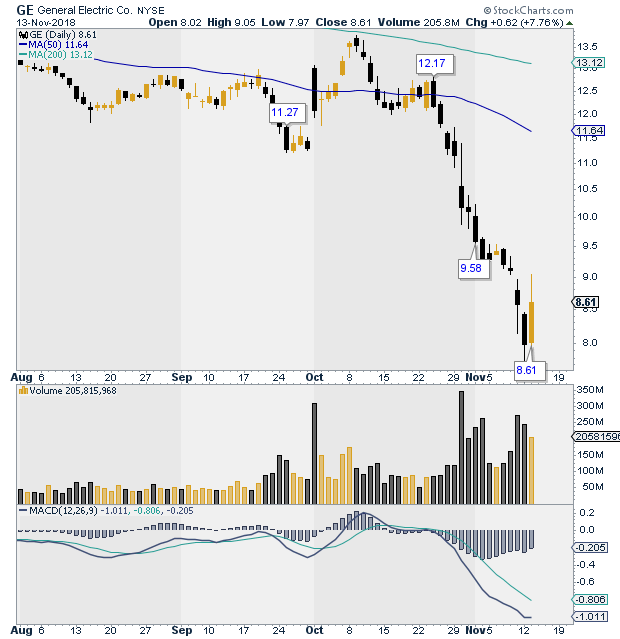
| Figure 1. Daily chart for GE. |
| Graphic provided by: StockCharts.com. |
| |
| When John F. (Jack) Welch sat atop GE from 1981 until 2001, his management skills became legendary, GE was corporate aristocracy. It could do no wrong. Welch wrote about his leadership abilities in books with names such as "Winning" and "The GE Way". Under Welch, GE saw enormous expansion, increasing its revenues from roughly $26 billion in 1979, the year before he took over, to about $130 billion in 2000, the year before he left. |
| Now with a market cap of roughly $75 billion, GE is a shadow of its former self. With that said, nothing lasts forever. True, GE could go to 0, but that seems unlikely. Therefore, what we are concerned with here is where the bottom is likely to be. At what price are investors likely to step in and create a floor for the stock? |
| The technicals do not give clear answers to these questions. A floor, also known as a basing area, is seen on the charts as price moves horizontally. If we look at Figure 1, that has not happened yet. We see that on November 13, 2018, the stock had a good day, rising $0.62, to close at $8.61 and therefore attracting market attention. But caution is advised, one day does not create a trend. As a chart watcher, more evidence is needed. |

|
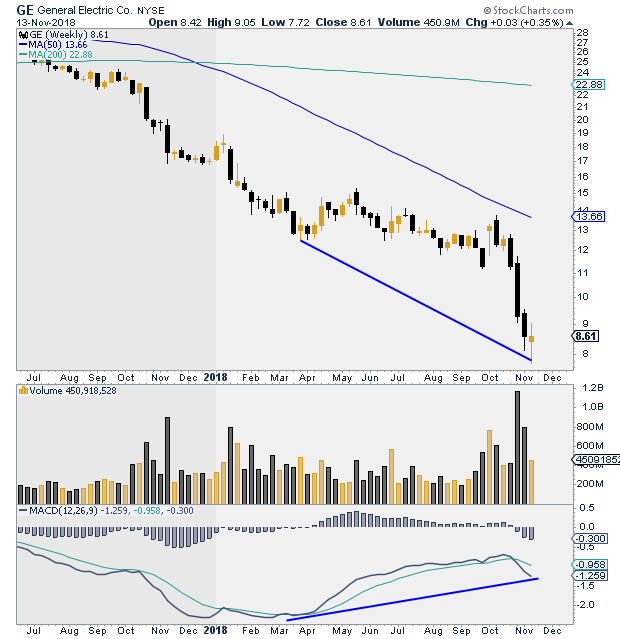
| Figure 2. Weekly chart for GE. |
| Graphic provided by: StockCharts.com. |
| |
| On October 24, 2018, a bearish candle formed taking price below its 50-day MA. After that, GE's decline increased and the stock experienced a parabolic drop. Often an acceleration of this kind, also known as a selling spike, can be a fore warning that the price is about to bottom. When everyone who wants to sell has sold and there is no one left to sell, it is likely that the stock's price will find a floor. But that on it's own isn't enough to reach a conclusion as to the likely next direction of price. A preponderance of the evidence is what to look for. A look at the weekly chart (See Figure 2) shows that price has formed a positive divergence with the MACD, another positive sign. The only thing left to see is the basing price action mentioned earlier. Let GE show that it has reached a floor either by basing for at least several weeks, or by a successful test its November 2018 low. That is the best way to decide if the worst is actually over. |
Stella Osoba is a trader and financial writer. She is a frequent contributor to "Technical Analysis of Stocks and Commodities" magazine and "Traders.com Advantage" as well as other financial publications.
| E-mail address: | stellaosoba@gmail.com |
Click here for more information about our publications!
PRINT THIS ARTICLE

Request Information From Our Sponsors
- VectorVest, Inc.
- Executive Premier Workshop
- One-Day Options Course
- OptionsPro
- Retirement Income Workshop
- Sure-Fire Trading Systems (VectorVest, Inc.)
- Trading as a Business Workshop
- VectorVest 7 EOD
- VectorVest 7 RealTime/IntraDay
- VectorVest AutoTester
- VectorVest Educational Services
- VectorVest OnLine
- VectorVest Options Analyzer
- VectorVest ProGraphics v6.0
- VectorVest ProTrader 7
- VectorVest RealTime Derby Tool
- VectorVest Simulator
- VectorVest Variator
- VectorVest Watchdog
- StockCharts.com, Inc.
- Candle Patterns
- Candlestick Charting Explained
- Intermarket Technical Analysis
- John Murphy on Chart Analysis
- John Murphy's Chart Pattern Recognition
- John Murphy's Market Message
- MurphyExplainsMarketAnalysis-Intermarket Analysis
- MurphyExplainsMarketAnalysis-Visual Analysis
- StockCharts.com
- Technical Analysis of the Financial Markets
- The Visual Investor
