

HOT TOPICS LIST
- MACD
- Fibonacci
- RSI
- Gann
- ADXR
- Stochastics
- Volume
- Triangles
- Futures
- Cycles
- Volatility
- ZIGZAG
- MESA
- Retracement
- Aroon
INDICATORS LIST
LIST OF TOPICS
PRINT THIS ARTICLE
by Matt Blackman
During a rally, short-term interest rates (yields) on three-month bonds tend to remain well below 20-30 year bond yields. But when that relationship gets upended, it usually spells trouble.
Position: N/A
Matt Blackman
Matt Blackman is a full-time technical and financial writer and trader. He produces corporate and financial newsletters, and assists clients in getting published in the mainstream media. Matt has earned the Chartered Market Technician (CMT) designation. Follow Matt on Twitter at www.twitter.com/RatioTrade
PRINT THIS ARTICLE
MARKET TIMING
Market Diagnostic - The Yield Curve
11/15/18 03:44:05 PMby Matt Blackman
During a rally, short-term interest rates (yields) on three-month bonds tend to remain well below 20-30 year bond yields. But when that relationship gets upended, it usually spells trouble.
Position: N/A
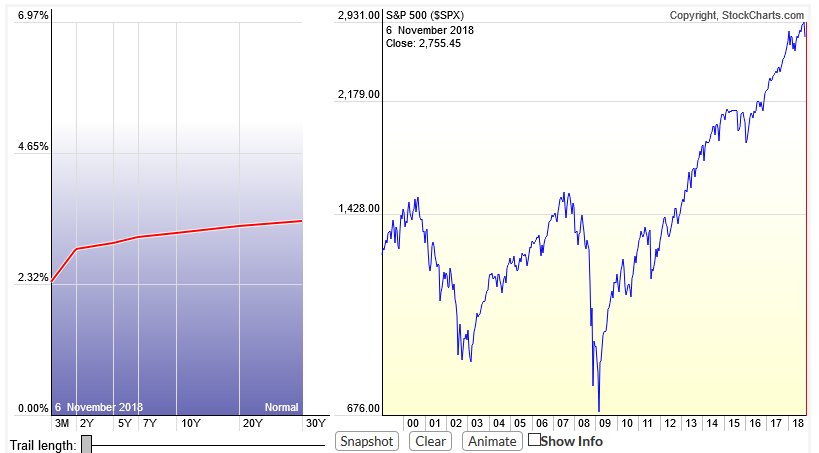
| Bond prices and interest rates move in opposite directions. When interest rates drop, bond prices rise and vice-versa. One good gauge of stock market health is the yield curve — the spread between short term (three-month yields) and long term Treasury bonds (20-30 year yields). History tells us that when short-term yields rise above long-term and the yield curve becomes inverted, that the risk of recession is high. So how well has this indicator worked? Between 1953 and 2009, a flattening yield curve provided warning in seven of the ten recessions. However, the relationship is not lock-step: the warning period in advance of each recession has varied. So what is the yield curve telling us now? |
|
| Figure 1. Yield curve and S&P500 Index on November 6, 2018, showing the flattening trend. |
| Graphic provided by: StockCharts.com. |
| |
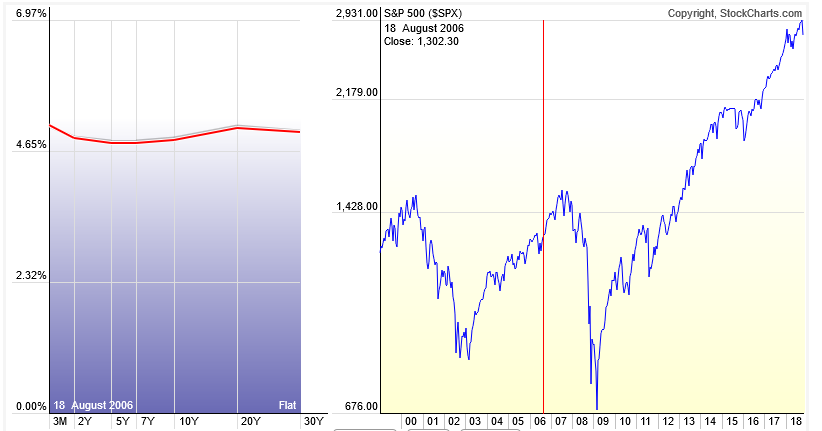
| As we see in Figure 1, short-term yields have been rising faster than long-term yields but the relationship remains well below curve inversion. This is in stark contrast to the period of 2006-2007, the last time the yield curve inverted, as we see in Figure 2. |
|
| Figure 2. The yield curve in the second part of August 2006 showed that the three-month yield was above longer-term yields more than a year in advance of the S&P500 peak in October 2007. |
| Graphic provided by: StockCharts.com. |
| |
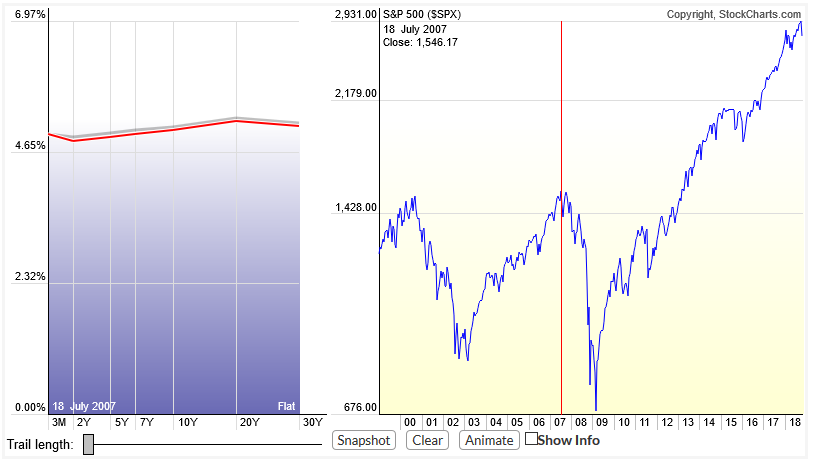
| The S&P 500 Index peaked in October 2007 just above 1575 at which point the yield curve (see Figure 3) had a slight slope so was no longer inverted. Assuming that this meant the risk of a stock correction was over would have been a very expensive one indeed! |
|
| |
| As traders who study stock market history quickly learn, major market corrections and recessions have a host of similar triggers including rising interest rates, but the primary catalyst is different each time. For example, rising interest rates from 1970 to 1981 when Treasury yields rose above 15 percent was a major contributor to the 1981-2 stock market meltdown. However, interest rates were significantly lower and falling leading into the next major stock market internet peak in 2000, so were less of a factor in that subsequent correction and recession. There are a host of challenges facing this stock market rally, namely record levels of debt, high stock valuations, emerging market currency weakness, continuing trade battles and geopolitical tensions; any one or group of which could lead to the next stock peak and subsequent recession. The important takeaway is that it is critically important that traders don't ignore important signals that the probability of a correction is getting high because by the time a recession has been confirmed by the National Bureau of Economic Research (NBER), most of the damage to your portfolio has already been done. |
Matt Blackman is a full-time technical and financial writer and trader. He produces corporate and financial newsletters, and assists clients in getting published in the mainstream media. Matt has earned the Chartered Market Technician (CMT) designation. Follow Matt on Twitter at www.twitter.com/RatioTrade
| Title: | Author |
| Company: | TradeSystemGuru |
| Address: | Box 2589 |
| Garibaldi Highlands, BC V0N1T0 | |
| Phone # for sales: | 6048989069 |
| E-mail address: | indextradermb@gmail.com |
Traders' Resource Links | |
| TradeSystemGuru has not added any product or service information to TRADERS' RESOURCE. | |
Click here for more information about our publications!
PRINT THIS ARTICLE

Request Information From Our Sponsors
- StockCharts.com, Inc.
- Candle Patterns
- Candlestick Charting Explained
- Intermarket Technical Analysis
- John Murphy on Chart Analysis
- John Murphy's Chart Pattern Recognition
- John Murphy's Market Message
- MurphyExplainsMarketAnalysis-Intermarket Analysis
- MurphyExplainsMarketAnalysis-Visual Analysis
- StockCharts.com
- Technical Analysis of the Financial Markets
- The Visual Investor
- VectorVest, Inc.
- Executive Premier Workshop
- One-Day Options Course
- OptionsPro
- Retirement Income Workshop
- Sure-Fire Trading Systems (VectorVest, Inc.)
- Trading as a Business Workshop
- VectorVest 7 EOD
- VectorVest 7 RealTime/IntraDay
- VectorVest AutoTester
- VectorVest Educational Services
- VectorVest OnLine
- VectorVest Options Analyzer
- VectorVest ProGraphics v6.0
- VectorVest ProTrader 7
- VectorVest RealTime Derby Tool
- VectorVest Simulator
- VectorVest Variator
- VectorVest Watchdog