

HOT TOPICS LIST
- MACD
- Fibonacci
- RSI
- Gann
- ADXR
- Stochastics
- Volume
- Triangles
- Futures
- Cycles
- Volatility
- ZIGZAG
- MESA
- Retracement
- Aroon
INDICATORS LIST
LIST OF TOPICS
PRINT THIS ARTICLE
by Fawad Razaqzada
Looking for divergences between correlating markets can lead to FX trading opportunities.
Position: N/A
Fawad Razaqzada
Fawad Razaqzada is an experienced analyst and economist having been involved in the financial markets since 2010 working for leading global FX and CFD brokerages. Having graduated with a degree in economics and leveraging years of financial market experience, Fawad provides retail and professional traders worldwide with succinct fundamental & technical analysis. In addition, he also offers premium trade signals to subscribers, and trading education to help shorten the learning curves of developing traders. He has also been trading on his personal account for many years. Follow Fawad on twitter @Trader_F_R or visit his website at TradingCandles.com.
PRINT THIS ARTICLE
TECHNICAL ANALYSIS
Intermarket Analysis: Alternative Way Of Spotting Opportunities In FX
11/12/18 12:11:09 PMby Fawad Razaqzada
Looking for divergences between correlating markets can lead to FX trading opportunities.
Position: N/A
| Intermarket analysis is a form of technical analysis that observes the relationship between various asset classes such as stocks, bonds, commodities, and currencies. This form of analysis can be particularly useful to FX over other types of asset classes. |
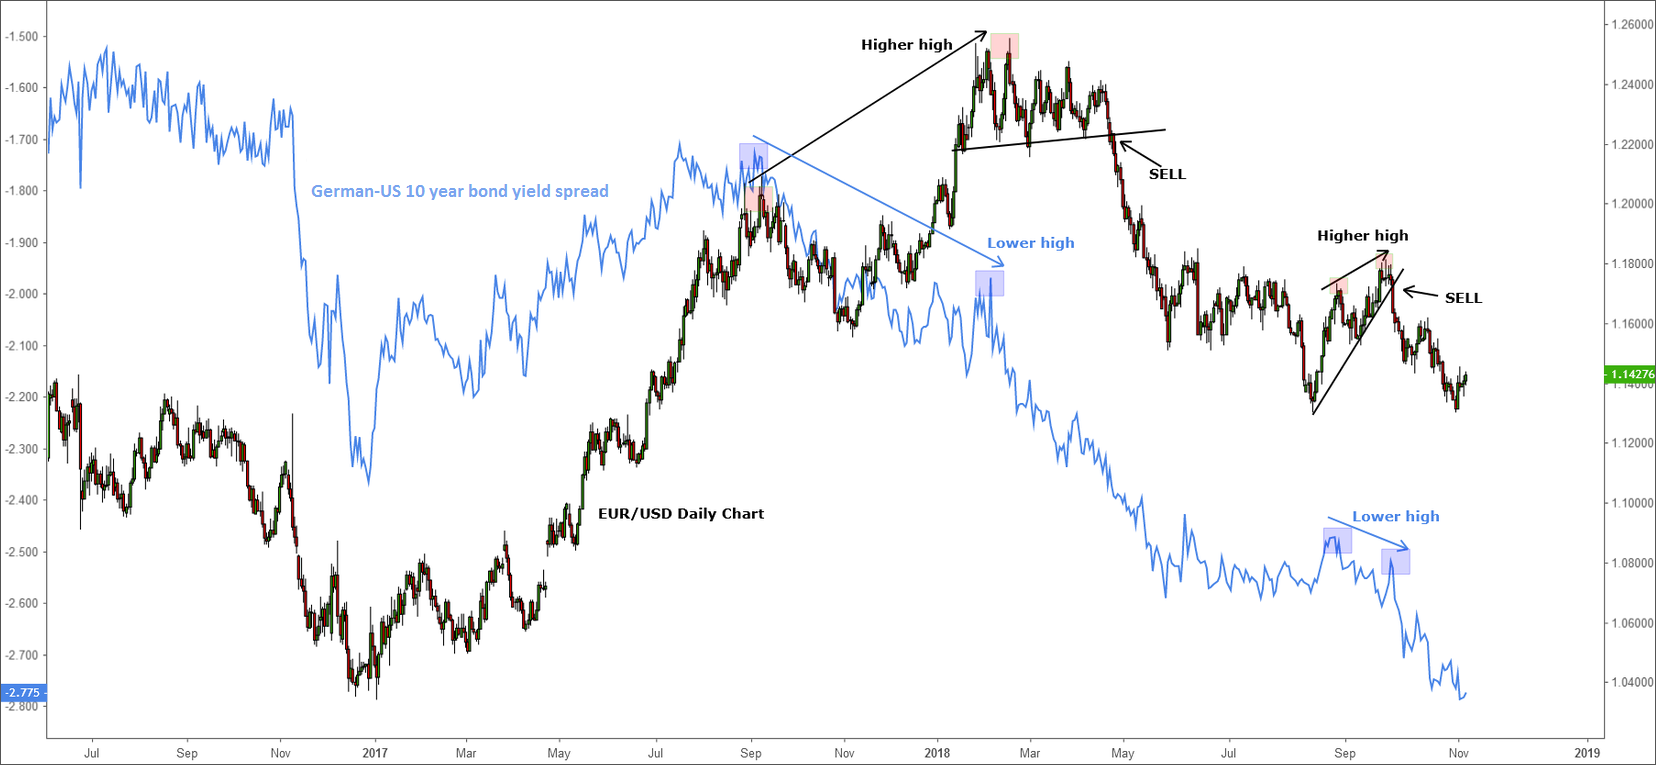
| The most obvious example is in the utilization of government bond yields, which tend to be among the biggest fundamental drivers of FX. When country A's yields rise at a faster pace than B — due, for example, to better economic performance — the exchange rate tends to rise in favor of A. To illustrate this point, please refer to the chart in Figure 1, showing the yield spread between 10-year German and US bonds. As can be seen, this spread has had a strong positive correlation with the EUR/USD exchange rate. One of the many ways speculators could use this type of correlation is by looking for signs of divergence. In this example, the EUR/USD made a higher high in early 2018 relative to its old high around September 2017. But at the same time, the German-US yield spread had made a lower high. This was a clear sign that the EUR/USD had risen above its fundamental value based on interest rate differentials. This should've put speculators on the lookout for bearish technical setups on the EUR/USD. One clear sell signal subsequently emerged when the EUR/USD broke below the support of its triangle pattern in April 2018, around the 1.2200 handle. Another similar setup with the yields spread showing a negative difference was made in September 2018. This time, the break of the trend line on the EUR/USD could have been a very good sell setup. |
|
| Figure 1: EURUSD vs GER-US 10 YR YIELD1. |
| Graphic provided by: Tradingview.com. |
| |
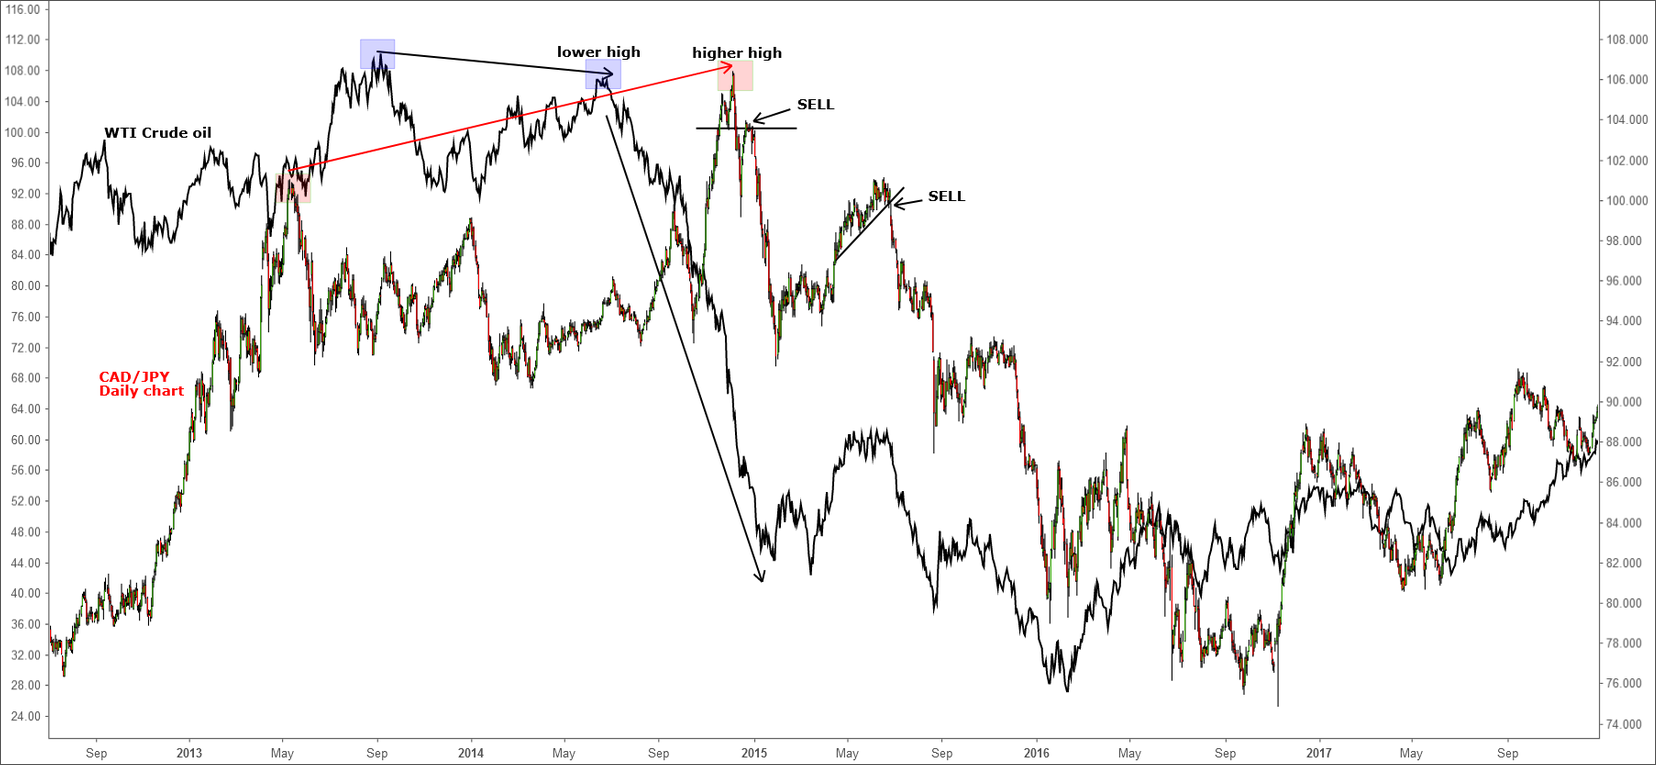
| In addition, you have the likes of the Canadian dollar and Norwegian Krone, which tend to correlate positively with oil prices given that crude makes up a large portion of these nation's exports. What's more, changes in prices of iron ore or copper tend to move the Australian dollar, while the New Zealand dollar tends to move along with unexpected changes in dairy prices. To illustrate this, have a look at Figure 2, showing the relationship between WTI oil and the CAD/JPY. Like the EUR/USD example, here crude prices made a lower high while the CAD/JPY made a higher high and thus formed a negative divergence. Oil prices went on to fall sharply well before the CAD started to move. One straight-forward entry on the CAD/JPY would have been to sell the rounded re-test of the broken support level around the 103.60 area in January 2015. Another obvious entry would have been in June 2015 when the CAD/JPY broke the short-term bullish trend line. |
|
| Figure 2. CADJPY vs WTI crude oil. |
| Graphic provided by: Tradingview.com. |
| |
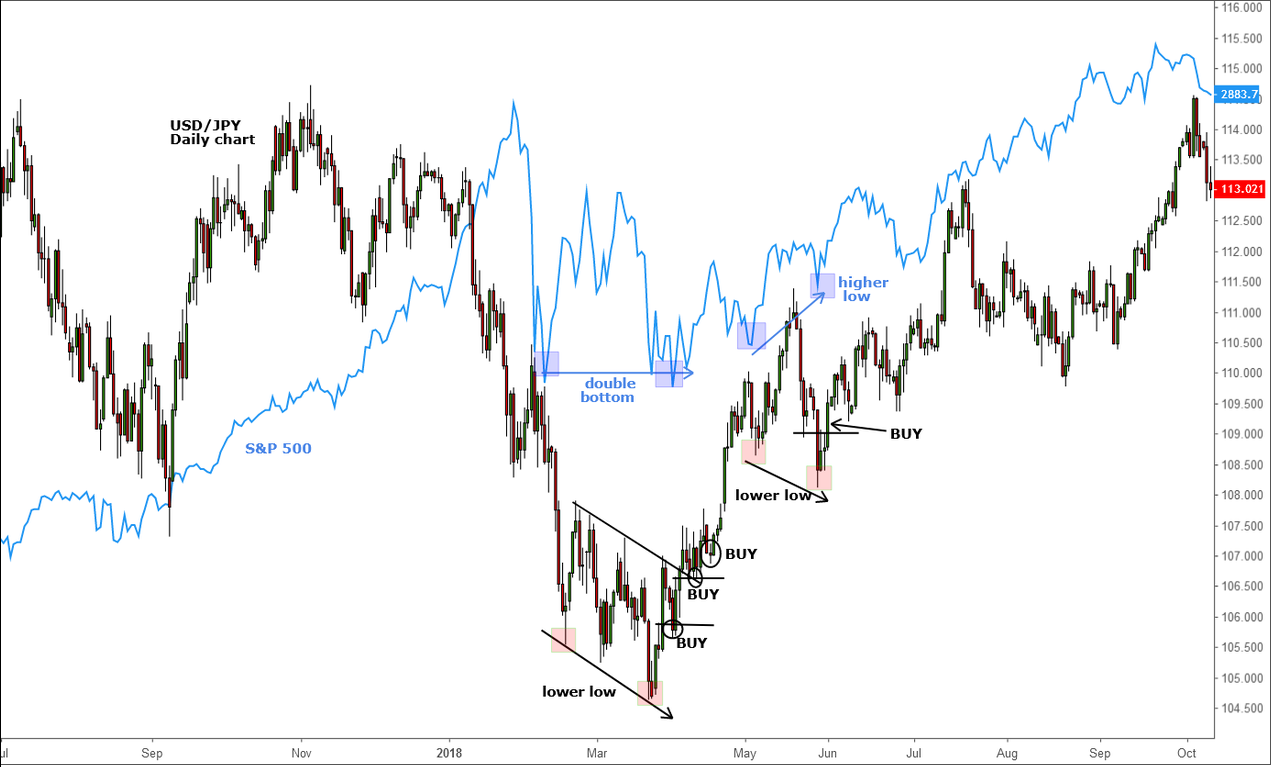
| Furthermore, there are so-called "safe-haven" currencies such as the Japanese yen and Swiss franc, which come into focus particularly during stock market rallies and turmoil. In Figure 3, this relationship is highlighted by the USD/JPY and the S&P 500, both generally going up and down in unison. In this example, the S&P 500 made a double bottom low in April while the USD/JPY made a lower low. A month later, the S&P formed a higher low and, once again, the USD/JPY formed a lower low. Both cases were examples of positive divergence. Speculators could have bought the dips back into support on the USD/JPY, based on the bullish behavior of the stock markets — such as the areas highlighted on the chart. |
|
| Figure 3. USDJPY vs SPX. |
| Graphic provided by: Tradingview.com. |
| |
Fawad Razaqzada is an experienced analyst and economist having been involved in the financial markets since 2010 working for leading global FX and CFD brokerages. Having graduated with a degree in economics and leveraging years of financial market experience, Fawad provides retail and professional traders worldwide with succinct fundamental & technical analysis. In addition, he also offers premium trade signals to subscribers, and trading education to help shorten the learning curves of developing traders. He has also been trading on his personal account for many years. Follow Fawad on twitter @Trader_F_R or visit his website at TradingCandles.com.
| Title: | Financial Market Analyst |
| Company: | TradingCandles.com |
| London, | |
| Website: | tradingcandles.com |
| E-mail address: | fawad.razaqzada@hotmail.co.uk |
Traders' Resource Links | |
| TradingCandles.com has not added any product or service information to TRADERS' RESOURCE. | |
Click here for more information about our publications!
PRINT THIS ARTICLE

Request Information From Our Sponsors
- VectorVest, Inc.
- Executive Premier Workshop
- One-Day Options Course
- OptionsPro
- Retirement Income Workshop
- Sure-Fire Trading Systems (VectorVest, Inc.)
- Trading as a Business Workshop
- VectorVest 7 EOD
- VectorVest 7 RealTime/IntraDay
- VectorVest AutoTester
- VectorVest Educational Services
- VectorVest OnLine
- VectorVest Options Analyzer
- VectorVest ProGraphics v6.0
- VectorVest ProTrader 7
- VectorVest RealTime Derby Tool
- VectorVest Simulator
- VectorVest Variator
- VectorVest Watchdog
- StockCharts.com, Inc.
- Candle Patterns
- Candlestick Charting Explained
- Intermarket Technical Analysis
- John Murphy on Chart Analysis
- John Murphy's Chart Pattern Recognition
- John Murphy's Market Message
- MurphyExplainsMarketAnalysis-Intermarket Analysis
- MurphyExplainsMarketAnalysis-Visual Analysis
- StockCharts.com
- Technical Analysis of the Financial Markets
- The Visual Investor