

HOT TOPICS LIST
- MACD
- Fibonacci
- RSI
- Gann
- ADXR
- Stochastics
- Volume
- Triangles
- Futures
- Cycles
- Volatility
- ZIGZAG
- MESA
- Retracement
- Aroon
INDICATORS LIST
LIST OF TOPICS
PRINT THIS ARTICLE
by Matt Blackman
Amazon has been a high-flyer over the last twelve years but is it now telling us that the worst is over for it and tech stocks?
Position: Sell
Matt Blackman
Matt Blackman is a full-time technical and financial writer and trader. He produces corporate and financial newsletters, and assists clients in getting published in the mainstream media. Matt has earned the Chartered Market Technician (CMT) designation. Follow Matt on Twitter at www.twitter.com/RatioTrade
PRINT THIS ARTICLE
BULL/BEAR MARKET
Amazon - A Harbinger of the Bear?
11/01/18 04:09:02 PMby Matt Blackman
Amazon has been a high-flyer over the last twelve years but is it now telling us that the worst is over for it and tech stocks?
Position: Sell
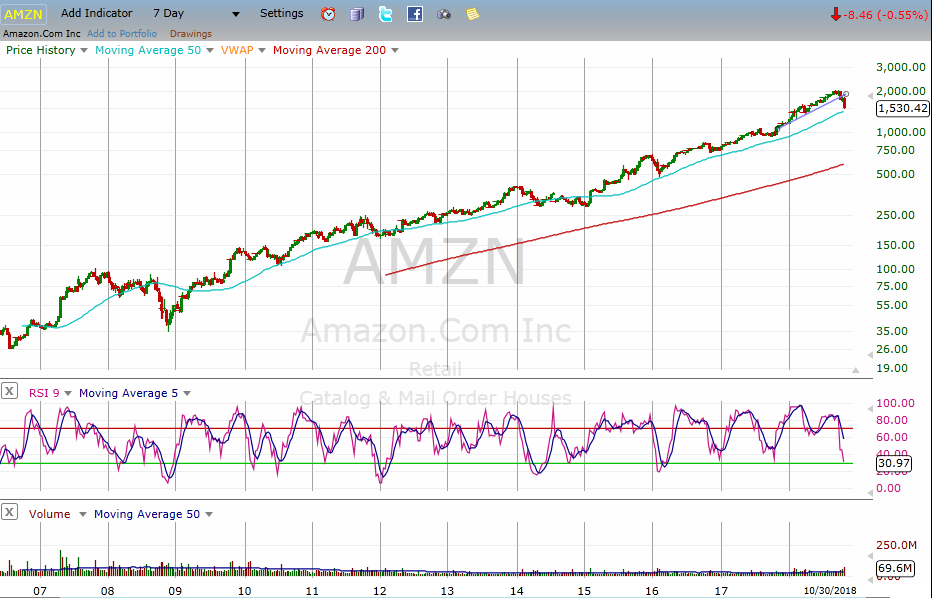
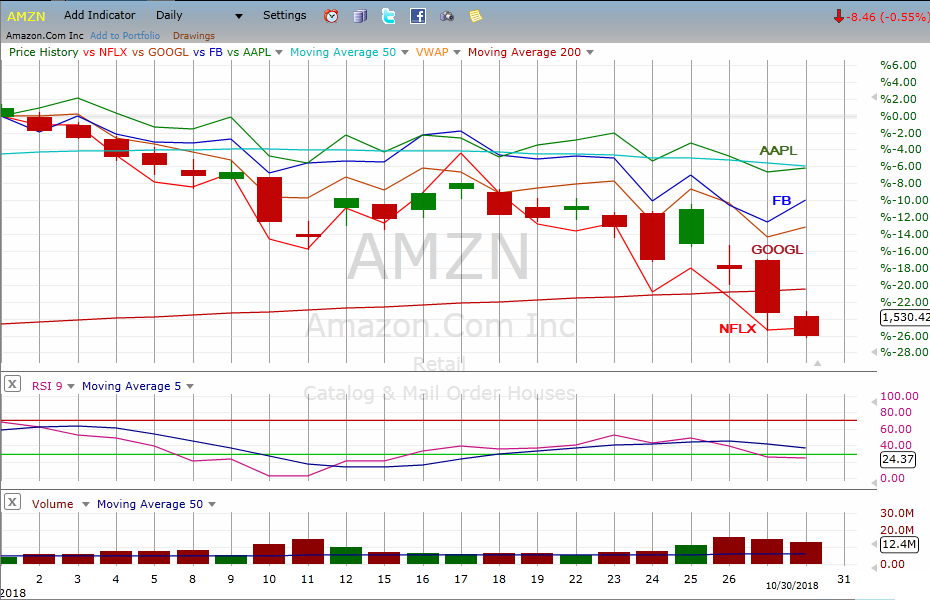
| On September 4, 2018 Amazon hit a daily high of $2050.50 per share. It has been an incredible rise by any standards. Year-to-date, the stock had gained more than 74%. But since its low during the first week of August 2006, it had gained more than 7500%! A member of the high flying FAANG group of stocks (Facebook, Amazon, Apple, Netflix and Google), it had only one rival, Netflix, which gained more than 13,000% over the same period. But as October 2018 was coming to an end, AMZN had lost 26% for the month which puts it in official bear market territory. NFLX was down about the same percentage. Is this telling us that the tech bull market is now under threat (see Figure 3)? |
|
| Figure 1. Daily chart of Amazon showing its march up the chart since 2006. |
| Graphic provided by: Freestockcharts.com. |
| |
| Many active traders, including world record-holder Dan Zanger, focus their efforts on finding market leading stocks — stocks with rapidly rising revenues, impressive year-over-year earnings growth, market leading products or services, a highly talented and capable management team — and companies that are leaders in their respective industries. Amazon has been a favorite of his since 2006 as have other stocks in the FAANG group. |
|
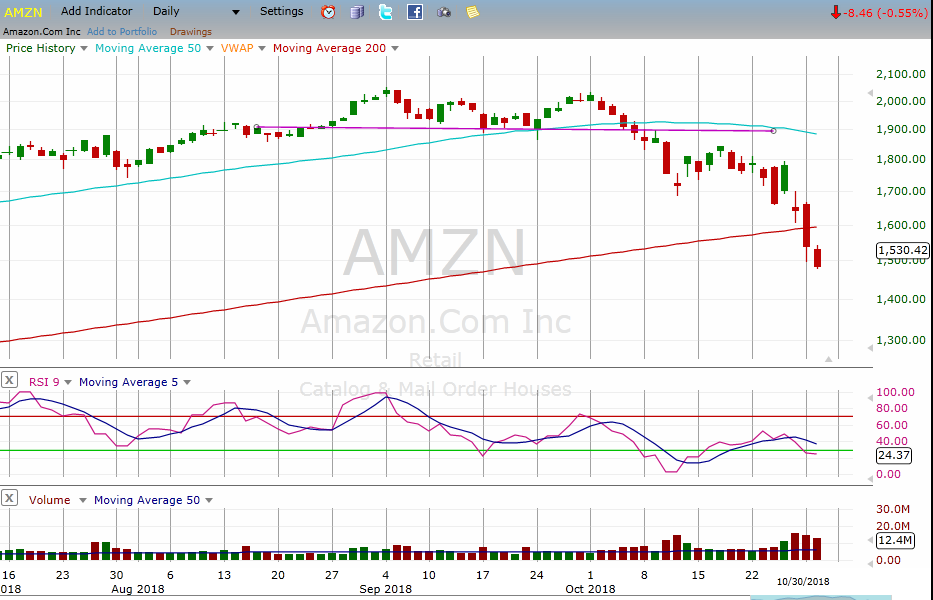
| Figure 2. Daily chart of Amazon from May through October 2018 showing the bearish double top (DT) chart pattern that was confirmed by a breach of the neckline on above average volume October 8 and retested with a failure to break up through it the next day. AMZN also decisively breached the 200-day moving average (red line) on October 29. |
| Graphic provided by: Freestockcharts.com. |
| |
| Many traders watched as AMZN put in a bearish double-top chart pattern (see Figure 2). Note that it quickly dropped below the minimum projected price drop target arrived at by subtracting the difference between the peak of the double top minus the neckline (2050 - 1902). The projected target was hit on October 10, just two days after the decisive neckline breach. What Amazon and other leading tech stocks do from here will tell us much about the health of the decade-long bull market in US stocks. But if this weakness continues, it is something that traders should not ignore! |
|
| Figure 3. Chart of FAANG stocks showing the performance of Amazon compared to the other members of the group, Facebook, Apple, Netflix and Google, during the cruelest month for stocks in 2018. |
| Graphic provided by: Freestockcharts.com. |
| |
Matt Blackman is a full-time technical and financial writer and trader. He produces corporate and financial newsletters, and assists clients in getting published in the mainstream media. Matt has earned the Chartered Market Technician (CMT) designation. Follow Matt on Twitter at www.twitter.com/RatioTrade
| Title: | Author |
| Company: | TradeSystemGuru |
| Address: | Box 2589 |
| Garibaldi Highlands, BC V0N1T0 | |
| Phone # for sales: | 6048989069 |
| E-mail address: | indextradermb@gmail.com |
Traders' Resource Links | |
| TradeSystemGuru has not added any product or service information to TRADERS' RESOURCE. | |
Click here for more information about our publications!
Comments

Request Information From Our Sponsors
- StockCharts.com, Inc.
- Candle Patterns
- Candlestick Charting Explained
- Intermarket Technical Analysis
- John Murphy on Chart Analysis
- John Murphy's Chart Pattern Recognition
- John Murphy's Market Message
- MurphyExplainsMarketAnalysis-Intermarket Analysis
- MurphyExplainsMarketAnalysis-Visual Analysis
- StockCharts.com
- Technical Analysis of the Financial Markets
- The Visual Investor
- VectorVest, Inc.
- Executive Premier Workshop
- One-Day Options Course
- OptionsPro
- Retirement Income Workshop
- Sure-Fire Trading Systems (VectorVest, Inc.)
- Trading as a Business Workshop
- VectorVest 7 EOD
- VectorVest 7 RealTime/IntraDay
- VectorVest AutoTester
- VectorVest Educational Services
- VectorVest OnLine
- VectorVest Options Analyzer
- VectorVest ProGraphics v6.0
- VectorVest ProTrader 7
- VectorVest RealTime Derby Tool
- VectorVest Simulator
- VectorVest Variator
- VectorVest Watchdog