HOT TOPICS LIST
- MACD
- Fibonacci
- RSI
- Gann
- ADXR
- Stochastics
- Volume
- Triangles
- Futures
- Cycles
- Volatility
- ZIGZAG
- MESA
- Retracement
- Aroon
INDICATORS LIST
LIST OF TOPICS
PRINT THIS ARTICLE
by Andrew Hetherington
General Electric is about to break out topside of a 3-month ascending triangle.
Position: N/A
Andrew Hetherington
Classic Dow Theorist who trades as a pure technician, using pattern recognition.
PRINT THIS ARTICLE
CHART ANALYSIS
General Electric is Ready to Light the Way!
12/17/02 09:50:34 AMby Andrew Hetherington
General Electric is about to break out topside of a 3-month ascending triangle.
Position: N/A
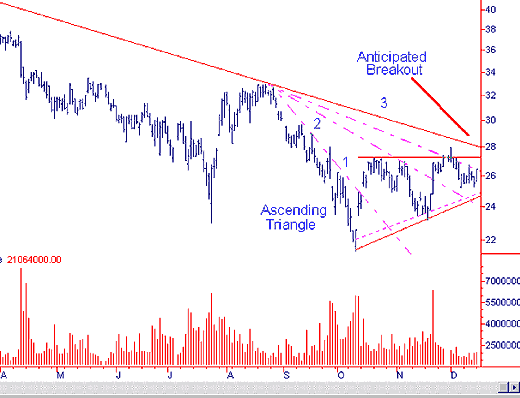
 Figure 1: Daily chart of General Electric (GE). The triangle that has formed on GE's chart has near perfect volume and if the volume continues to increase as I think it will then the breakout will be confirmed. The breakout is in the $27.25 area and it is poised to break through my third fan line to change temporary direction from down to up. There is a tendency for these issues to jump over the lines so don't be surprised if it gaps a little. These gaps are created from the anticipation of those who can no longer wait to jump in and ride it upwards. They bid it up higher. This will be a breakaway gap. |
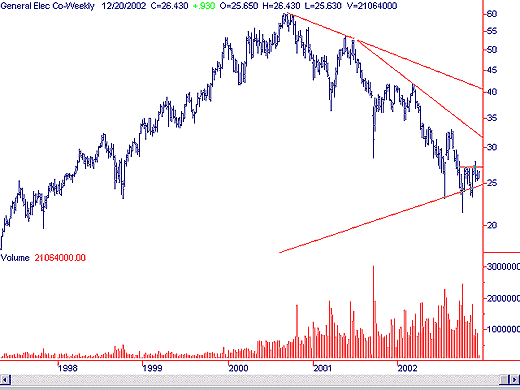
 Figure 2: Weekly chart of General Electric. In addition, Figure 2 of the weekly chart shows the intermediate term trendline is in the $32.00 area. This resistance will be a good area to lock in profits since it will likely back away from this line. While this may not be permanent, it is always easier to get back in at a lower price and accumulate more shares for the next ride up. |

|
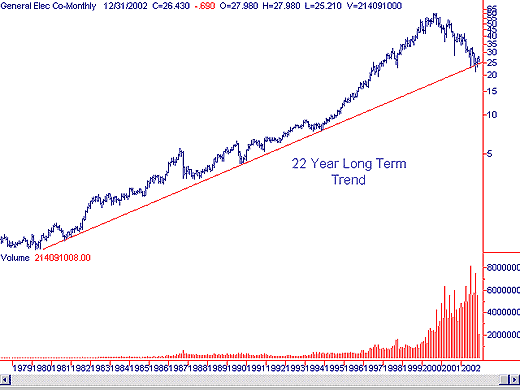
| Figure 3: Monthly chart of General Electric. |
| Graphic provided by: SuperCharts. |
| |
| The monthly chart in Figure 3 clearly shows that the 22-year long-term trend has not been broken. In most equities the long-term trend was broken. Whether or not this trendline breaks on the next down move is still unclear but for now the direction is up and accumulating a long position off of the 22-year trendline seems like the prudent trade. There is limited downside risk and if it fails to break topside on the first run at the $27.25 line with increasing volume then a sell order must be given immediately to protect your position. |
Classic Dow Theorist who trades as a pure technician, using pattern recognition.
| Toronto, Canada |
Click here for more information about our publications!
Comments
Date: 12/17/02Rank: 5Comment:
Date: 12/17/02Rank: 4Comment:
Date: 12/18/02Rank: 4Comment: i thought u had left as always good article
Date: 12/18/02Rank: 5Comment:
Date: 12/18/02Rank: 5Comment:
Date: 12/23/02Rank: 5Comment: I like the analysis style. More of this classic orthodox pattern recognition please!

Request Information From Our Sponsors
- StockCharts.com, Inc.
- Candle Patterns
- Candlestick Charting Explained
- Intermarket Technical Analysis
- John Murphy on Chart Analysis
- John Murphy's Chart Pattern Recognition
- John Murphy's Market Message
- MurphyExplainsMarketAnalysis-Intermarket Analysis
- MurphyExplainsMarketAnalysis-Visual Analysis
- StockCharts.com
- Technical Analysis of the Financial Markets
- The Visual Investor
- VectorVest, Inc.
- Executive Premier Workshop
- One-Day Options Course
- OptionsPro
- Retirement Income Workshop
- Sure-Fire Trading Systems (VectorVest, Inc.)
- Trading as a Business Workshop
- VectorVest 7 EOD
- VectorVest 7 RealTime/IntraDay
- VectorVest AutoTester
- VectorVest Educational Services
- VectorVest OnLine
- VectorVest Options Analyzer
- VectorVest ProGraphics v6.0
- VectorVest ProTrader 7
- VectorVest RealTime Derby Tool
- VectorVest Simulator
- VectorVest Variator
- VectorVest Watchdog
