HOT TOPICS LIST
- MACD
- Fibonacci
- RSI
- Gann
- ADXR
- Stochastics
- Volume
- Triangles
- Futures
- Cycles
- Volatility
- ZIGZAG
- MESA
- Retracement
- Aroon
INDICATORS LIST
LIST OF TOPICS
PRINT THIS ARTICLE
by Koos van der Merwe
A Kondratieff Wave is a long-term economic cycle. How accurate is its prediction?
Position: Sell
Koos van der Merwe
Has been a technical analyst since 1969, and has worked as a futures and options trader with First Financial Futures in Johannesburg, South Africa.
PRINT THIS ARTICLE
TECHNICAL ANALYSIS
Another Look At The K-Wave
10/17/18 04:06:03 PMby Koos van der Merwe
A Kondratieff Wave is a long-term economic cycle. How accurate is its prediction?
Position: Sell
| The Kondratieff Cycle has in the past been reasonable in forecasting market tops and bottoms of the S&P500 Index. Reasonably accurate because the K-Wave has not accurately predicted the day/week/month or year the index will correct, but it has suggested that a correction is likely to occur. With an Elliott wave count placed on the S&P500 index, a better idea of the fact that a correction is likely to occur in the near future is dominant. |

|
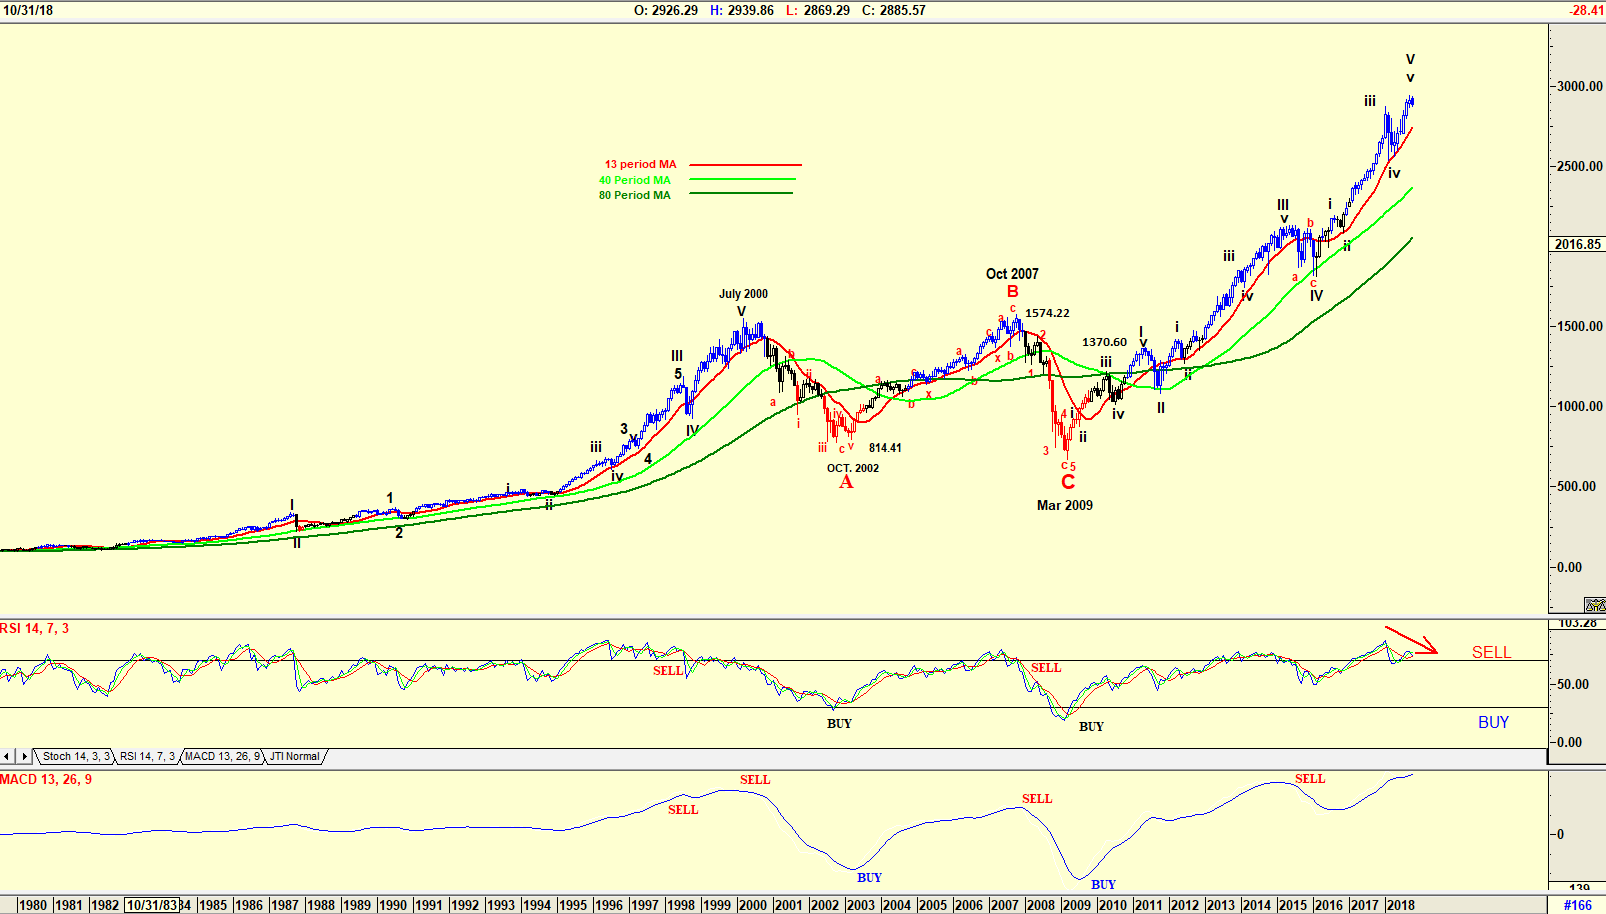
| Figure 1. Monthly chart of the S&P500 Index. |
| Graphic provided by: AdvancedGET. |
| |
| The chart in Figure 1 is a monthly chart of the S&P500 index with an Elliott wave count suggesting that a correction is just around the corner. The chart suggests that the index is probably completing a WAVE V. Both the RSI 14-period and MACD indicators are suggesting that a sell is on that cards. Being a monthly chart, this sell could occur in the coming months, weeks or days depending on market volatility. How reliable are the indicators? A look at the chart does show that the indicators are more reliable in giving a buy signal than a sell signal. However, there are many other indicators out there that could be more accurate. One should test them out. |

|
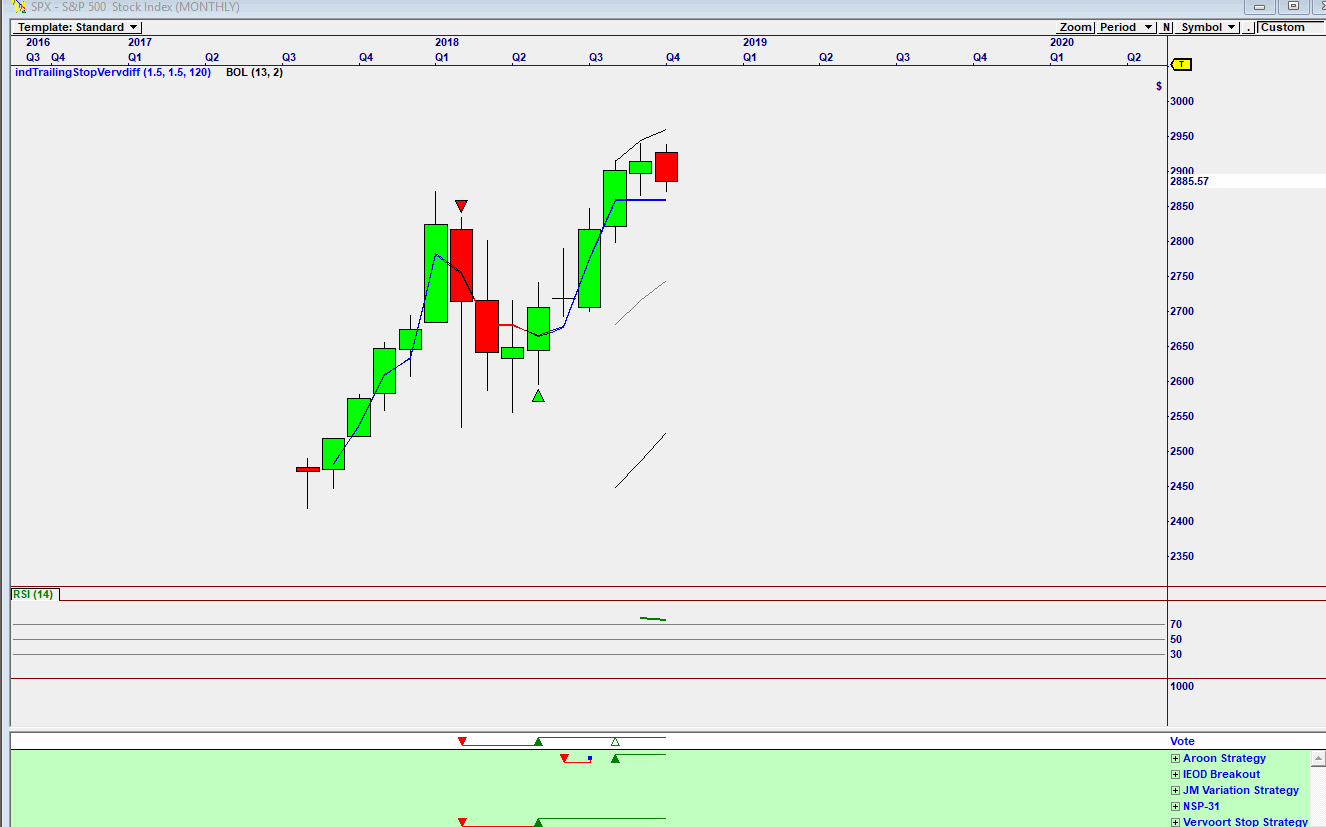
| Figure 2. Monthly chart of the S&P500 Index suggesting a possible future sell. |
| Graphic provided by: Omnitrader. |
| |
| The chart in Figure 2 is an Omnitrader chart showing the monthly buy/sell signals on the Vote line. The Vote line is still in buy mode based on the Aroon and Vervoort stop strategies. The chart itself has suggested a sell because the candlestick has turned red. |

|
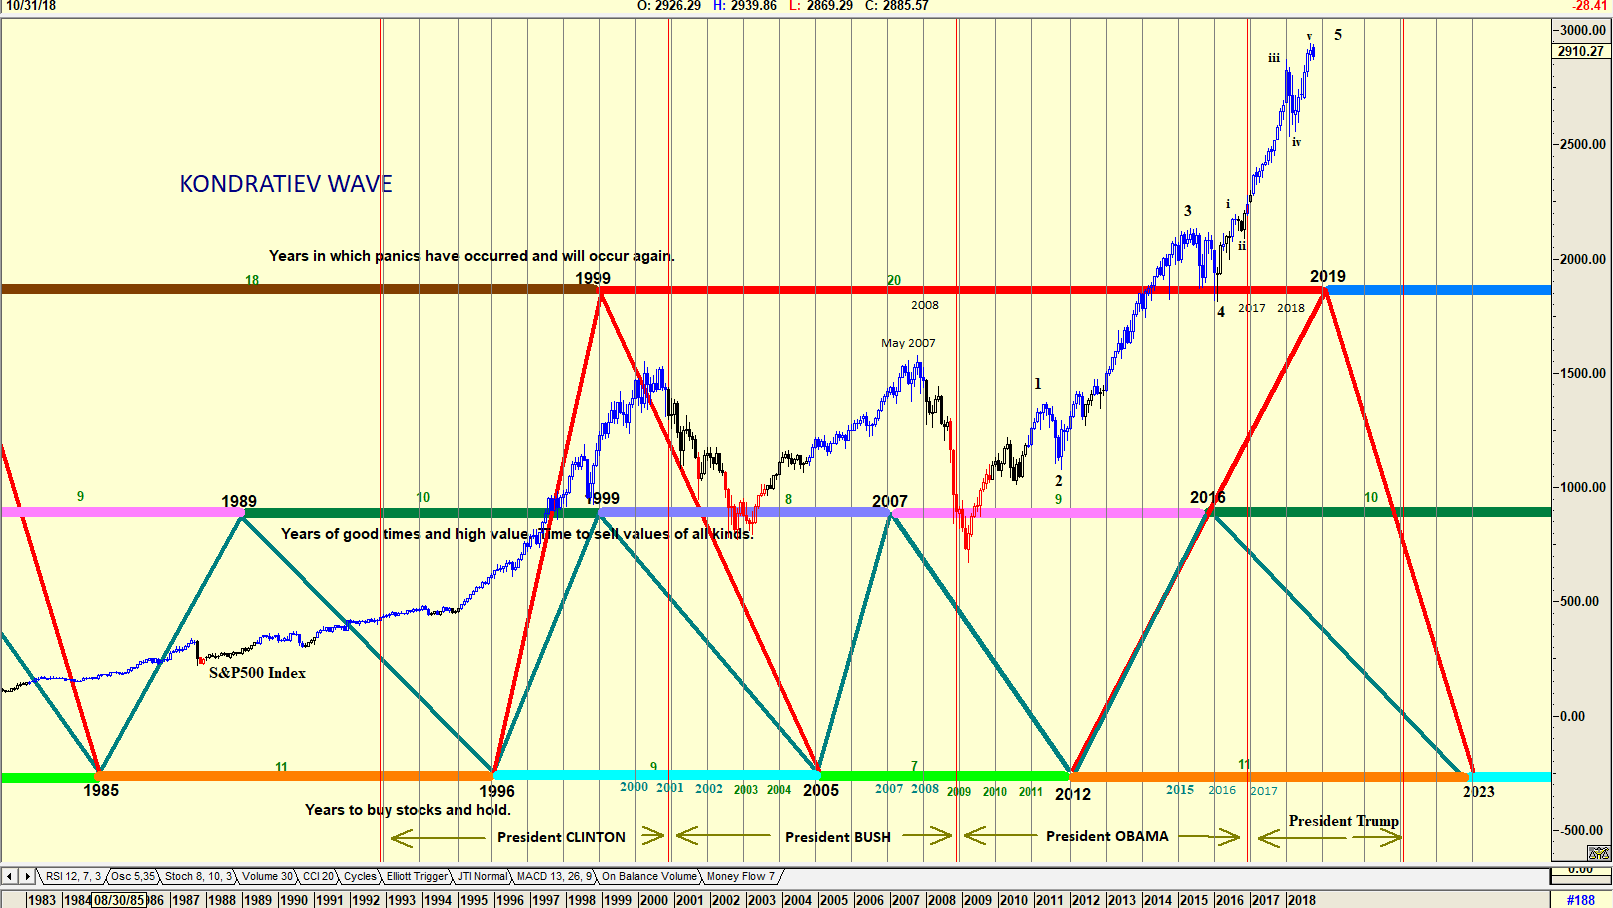
| Figure 3. Monthly chart of the S&P500 Index with the K-Wave. |
| Graphic provided by: AdvancedGET. |
| |
| Looking at the chart in Figure 3 with the S&P500 Index and the Kondratieff Wave, one can see that the K-Wave is calling for a correction in 2019. This could occur at anytime in 2019, possibly even occurring in early 2020 as suggested by previous corrections on the chart. With American elections in November; with the recent political drama with Brett Kavanaugh election to the Supreme Court; and with the K-Wave calling for a major correction around the corner, caution prevails. With talk-show host Ellen DeGeneres tweeting on Saturday, October 6 about Christine Ford's testimony, "You started a movement and we will see it through. If they won't listen to our voices, then they'll listen to our vote," the K-Wave correction could be in the offing. |
Has been a technical analyst since 1969, and has worked as a futures and options trader with First Financial Futures in Johannesburg, South Africa.
| Address: | 3256 West 24th Ave |
| Vancouver, BC | |
| Phone # for sales: | 6042634214 |
| E-mail address: | petroosp@gmail.com |
Click here for more information about our publications!
Comments
Date: 10/21/18Rank: 5Comment: Outstanding work!

Request Information From Our Sponsors
- StockCharts.com, Inc.
- Candle Patterns
- Candlestick Charting Explained
- Intermarket Technical Analysis
- John Murphy on Chart Analysis
- John Murphy's Chart Pattern Recognition
- John Murphy's Market Message
- MurphyExplainsMarketAnalysis-Intermarket Analysis
- MurphyExplainsMarketAnalysis-Visual Analysis
- StockCharts.com
- Technical Analysis of the Financial Markets
- The Visual Investor
- VectorVest, Inc.
- Executive Premier Workshop
- One-Day Options Course
- OptionsPro
- Retirement Income Workshop
- Sure-Fire Trading Systems (VectorVest, Inc.)
- Trading as a Business Workshop
- VectorVest 7 EOD
- VectorVest 7 RealTime/IntraDay
- VectorVest AutoTester
- VectorVest Educational Services
- VectorVest OnLine
- VectorVest Options Analyzer
- VectorVest ProGraphics v6.0
- VectorVest ProTrader 7
- VectorVest RealTime Derby Tool
- VectorVest Simulator
- VectorVest Variator
- VectorVest Watchdog
