HOT TOPICS LIST
- MACD
- Fibonacci
- RSI
- Gann
- ADXR
- Stochastics
- Volume
- Triangles
- Futures
- Cycles
- Volatility
- ZIGZAG
- MESA
- Retracement
- Aroon
INDICATORS LIST
LIST OF TOPICS
PRINT THIS ARTICLE
by Koos van der Merwe
Jeff Bezos has announced that Amazon is getting into healthcare. He is deciding to help homeless people and low-income communities with donations and not-for-profit schools.
Position: Sell
Koos van der Merwe
Has been a technical analyst since 1969, and has worked as a futures and options trader with First Financial Futures in Johannesburg, South Africa.
PRINT THIS ARTICLE
TECHNICAL ANALYSIS
A Look At Amazon
10/10/18 02:16:14 PMby Koos van der Merwe
Jeff Bezos has announced that Amazon is getting into healthcare. He is deciding to help homeless people and low-income communities with donations and not-for-profit schools.
Position: Sell
| "We'll use the same set of principles that have driven Amazon," he explains, encouragingly. "The child will be the customer." Is this truly going to happen, or is it simply another line of nonsense, similar to the line that Elon Musk is a humanitarian and that Mark Zuckerberg went to crucial early-primary states last year to share stories. Charity always begins at home, so he should look to improve the income of his own low-income workers. So, with a net worth of $163.2 billion, and said to be the richest man in America, what does the share of Amazon look like? Should one buy it or if you already own it, should you hold it? |

|
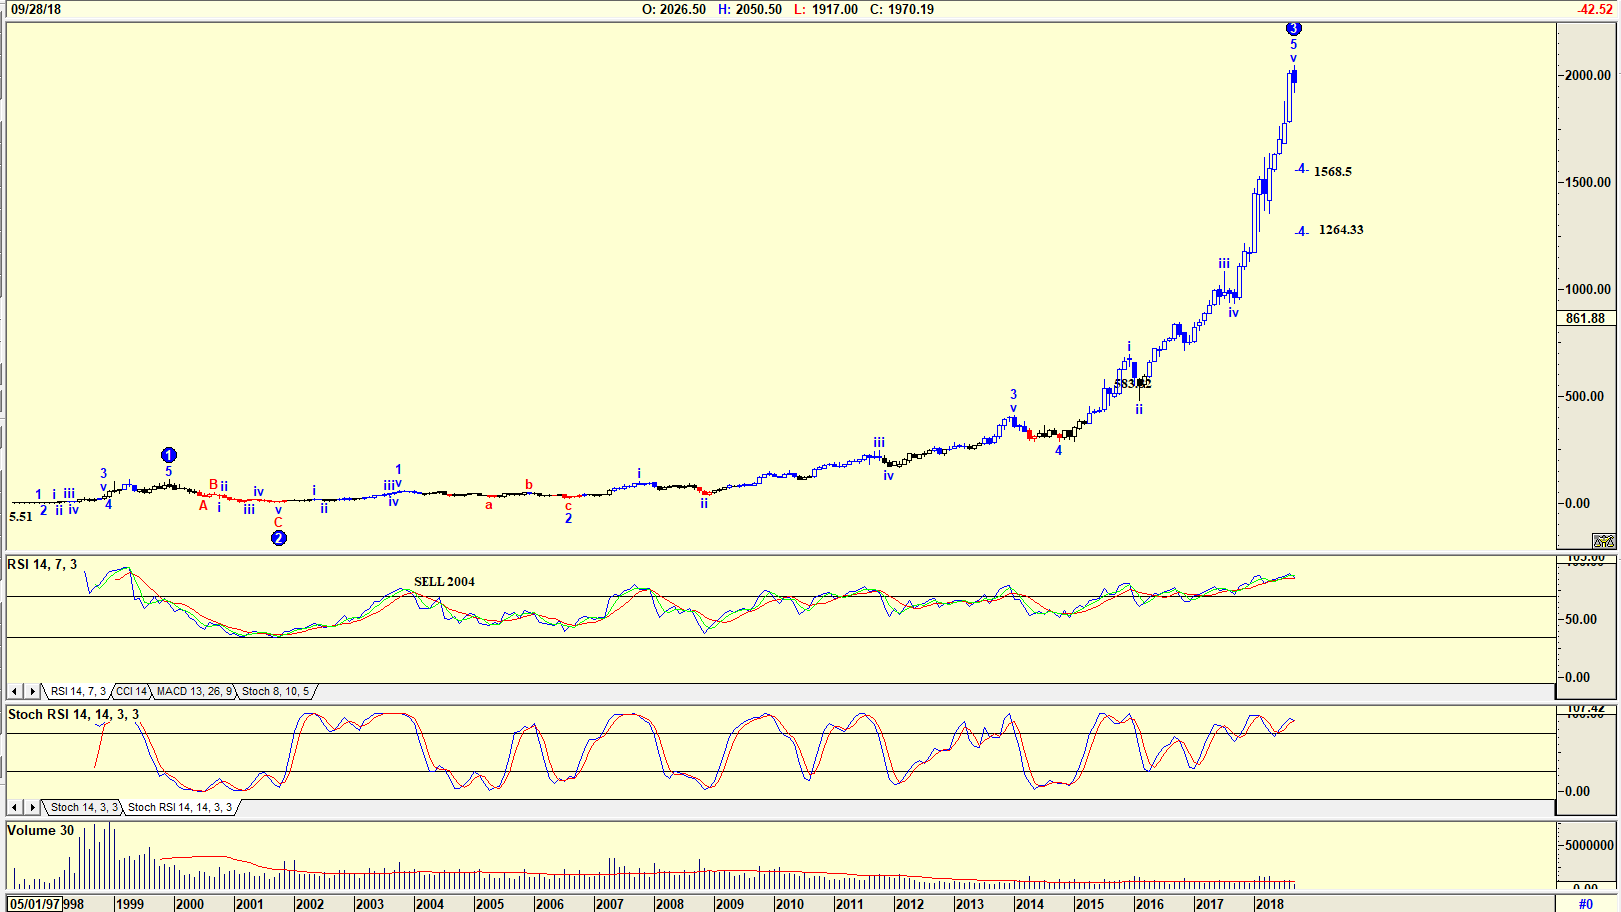
| Figure 1. Monthly chart with Elliott wave count. |
| Graphic provided by: AdvancedGET. |
| |
| The chart in Figure 1 is a monthly chart showing the price in 1997-1998 at $5.51. The share price closed at $1970.19 on Friday, September 15th, not a bad return had one bought the share at $5.51 and held. The chart does show an Elliott wave suggesting a possible WAVE 4 correction to either 1568.5 or 1264.33. The RSI indicator, however, has been suggesting a sell since 2004. The Stochastic RSI indicator has been more accurate continually giving buy/sell signals that would have been highly profitable had one followed them. Do note how volume has declined over the years, suggesting that less and less investors buy/trade the shares as the price rose. |

|
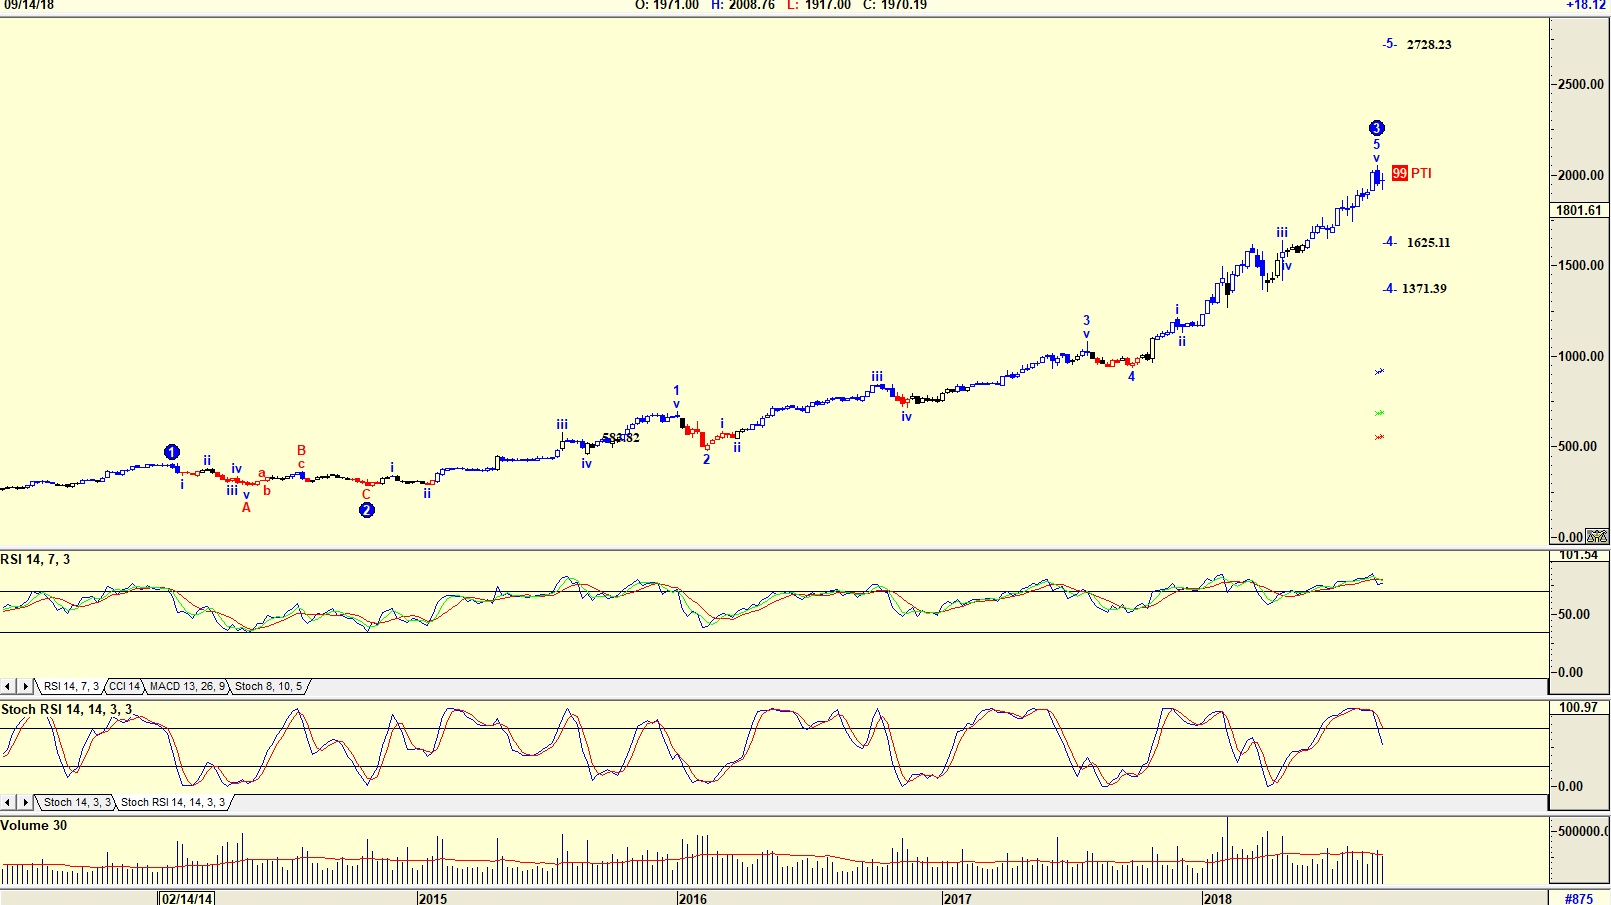
| Figure 2. Weekly chart with Elliott wave count. |
| Graphic provided by: AdvancedGET. |
| |
| The chart in Figure 2 is a weekly chart showing an Elliott wave count also suggesting that the share price could be in a WAVE 4 correction, possibly falling to 1625.11 or 1371.39. The chart is, however, suggesting that once the WAVE 4 correction is complete, the share could rise in a WAVE 5 to 2728.23. The PTI (Probability Index) is suggesting a 99% chance of this happening. With both the RSI and Stochastic RSI indicators showing weakness, the share should start correcting. |

|
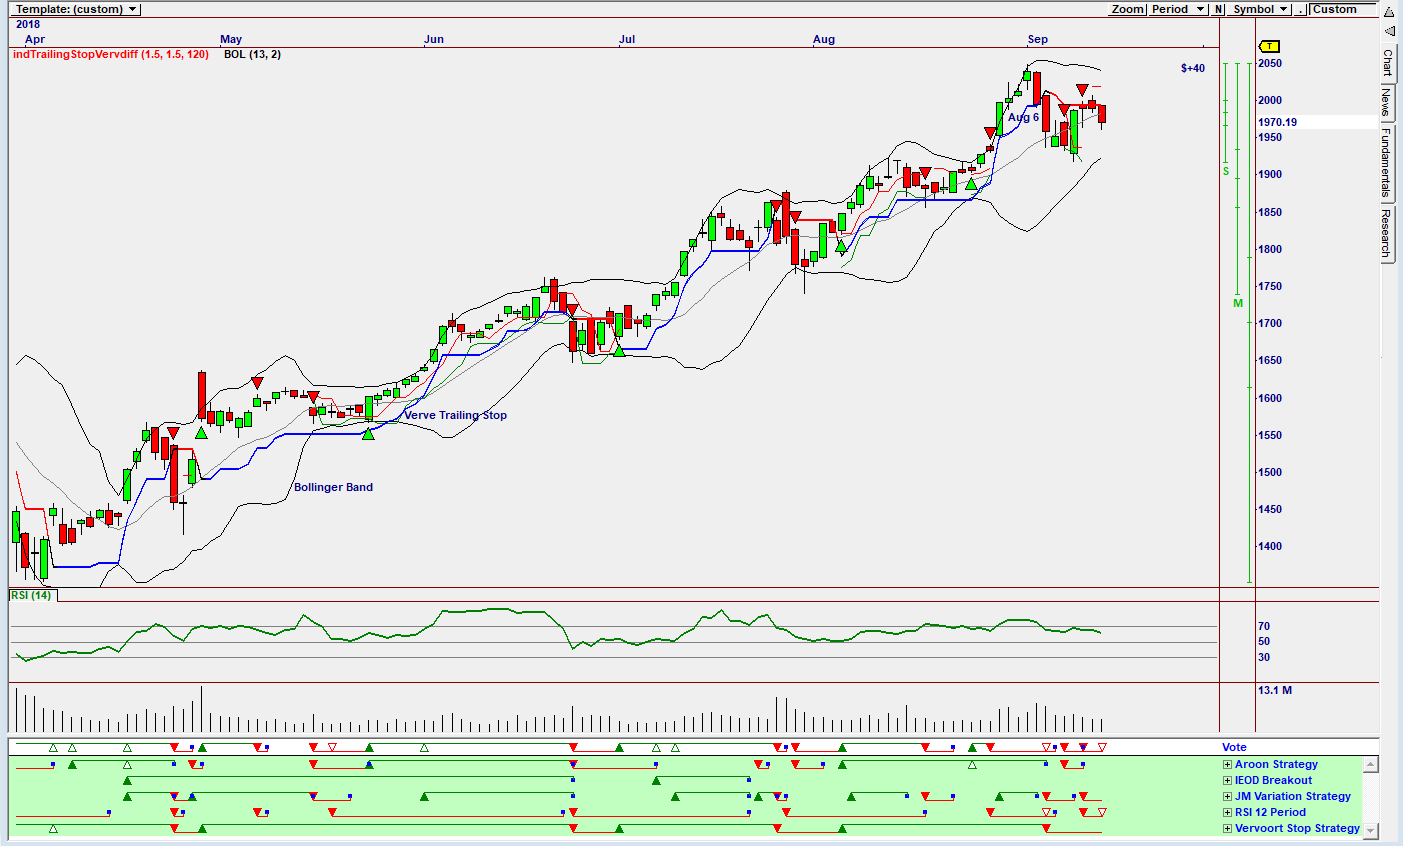
| Figure 3. Daily Omnitrader chart suggesting a sell. |
| Graphic provided by: Omnitrader. |
| |
| The chart in Figure 3 is an Omnitrader chart with the Vote line suggesting a sell based on the JM Variation Strategy, the RSI 12-period Strategy and the Vervoort Stop Strategy. Do note how the price has broken below the Verve trailing stop on the chart on August 6. With Jeff Bezos announcing his plan to help homeless people and low income communities catching everyone's attention, a look at the share of Amazon was a must. Would one buy the share? Not at the present time because charts are suggesting a correction could occur. For a future time? Once the correction is over, analyzing the charts to determine how high the share could rise and whether the % return on one's investment is acceptable, is another matter. The answer? Wait and see what happens and then re-calculate once a bottom has formed. |
Has been a technical analyst since 1969, and has worked as a futures and options trader with First Financial Futures in Johannesburg, South Africa.
| Address: | 3256 West 24th Ave |
| Vancouver, BC | |
| Phone # for sales: | 6042634214 |
| E-mail address: | petroosp@gmail.com |
Click here for more information about our publications!
PRINT THIS ARTICLE

Request Information From Our Sponsors
- StockCharts.com, Inc.
- Candle Patterns
- Candlestick Charting Explained
- Intermarket Technical Analysis
- John Murphy on Chart Analysis
- John Murphy's Chart Pattern Recognition
- John Murphy's Market Message
- MurphyExplainsMarketAnalysis-Intermarket Analysis
- MurphyExplainsMarketAnalysis-Visual Analysis
- StockCharts.com
- Technical Analysis of the Financial Markets
- The Visual Investor
- VectorVest, Inc.
- Executive Premier Workshop
- One-Day Options Course
- OptionsPro
- Retirement Income Workshop
- Sure-Fire Trading Systems (VectorVest, Inc.)
- Trading as a Business Workshop
- VectorVest 7 EOD
- VectorVest 7 RealTime/IntraDay
- VectorVest AutoTester
- VectorVest Educational Services
- VectorVest OnLine
- VectorVest Options Analyzer
- VectorVest ProGraphics v6.0
- VectorVest ProTrader 7
- VectorVest RealTime Derby Tool
- VectorVest Simulator
- VectorVest Variator
- VectorVest Watchdog
