HOT TOPICS LIST
- MACD
- Fibonacci
- RSI
- Gann
- ADXR
- Stochastics
- Volume
- Triangles
- Futures
- Cycles
- Volatility
- ZIGZAG
- MESA
- Retracement
- Aroon
INDICATORS LIST
LIST OF TOPICS
PRINT THIS ARTICLE
by Koos van der Merwe
Gold is usually a hedge against inflation and global turmoil.
Position: Accumulate
Koos van der Merwe
Has been a technical analyst since 1969, and has worked as a futures and options trader with First Financial Futures in Johannesburg, South Africa.
PRINT THIS ARTICLE
TECHNICAL ANALYSIS
Another Look At Gold
09/20/18 02:27:50 PMby Koos van der Merwe
Gold is usually a hedge against inflation and global turmoil.
Position: Accumulate
| The price of gold is down close to 8% this year. For one reason or another, it has lost its allure as a buy to hedge against inflation and any uncertainty that should occur in the stock market. This may be because of the US dollar, which is back to where it was in mid-2017. Investors could be looking at other alternatives to place their hedge bets. Bitcoin seems to be the best alternative, but with bitcoin prices now falling to new lows, the hedge does not seem to be bitcoin. So perhaps gold is on the sidelines, just waiting to be hit. Let us have a look. |

|
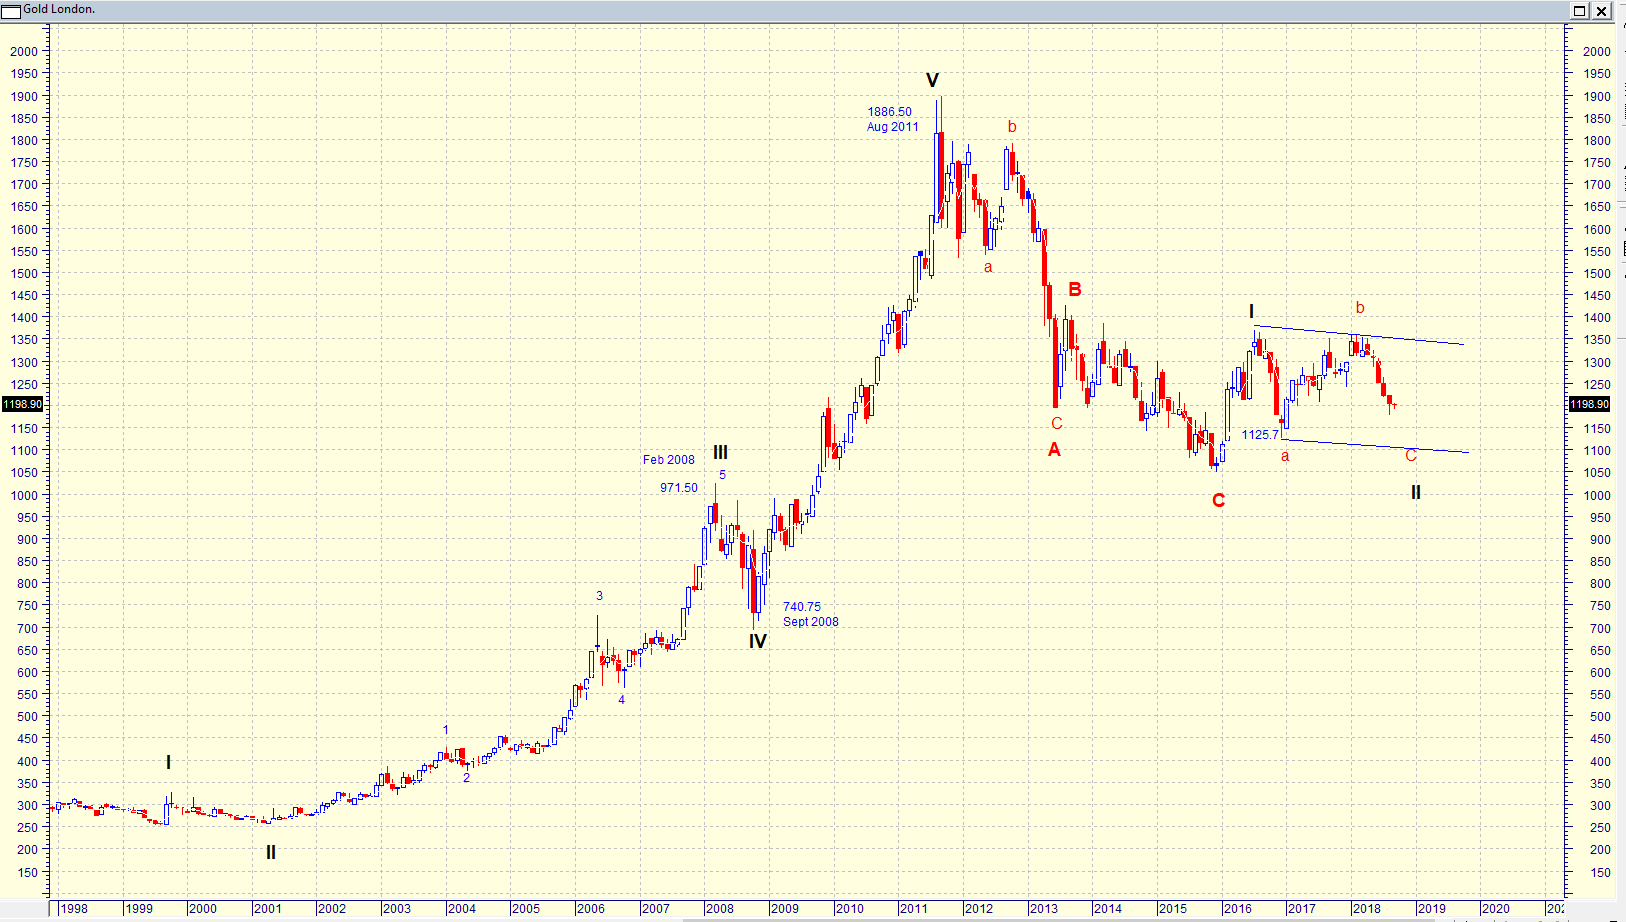
| Figure 1. Daily chart of the London Gold Price. |
| Graphic provided by: MetaStock. |
| |
| The chart in Figure 1 is a chart of the London Gold price that shows an Elliott wave count suggesting that the gold price could be tracing a WAVE II correction. Should this count be correct then the chart is suggesting that the gold price could fall to 1125.70 before rising in a WAVE III. |

|
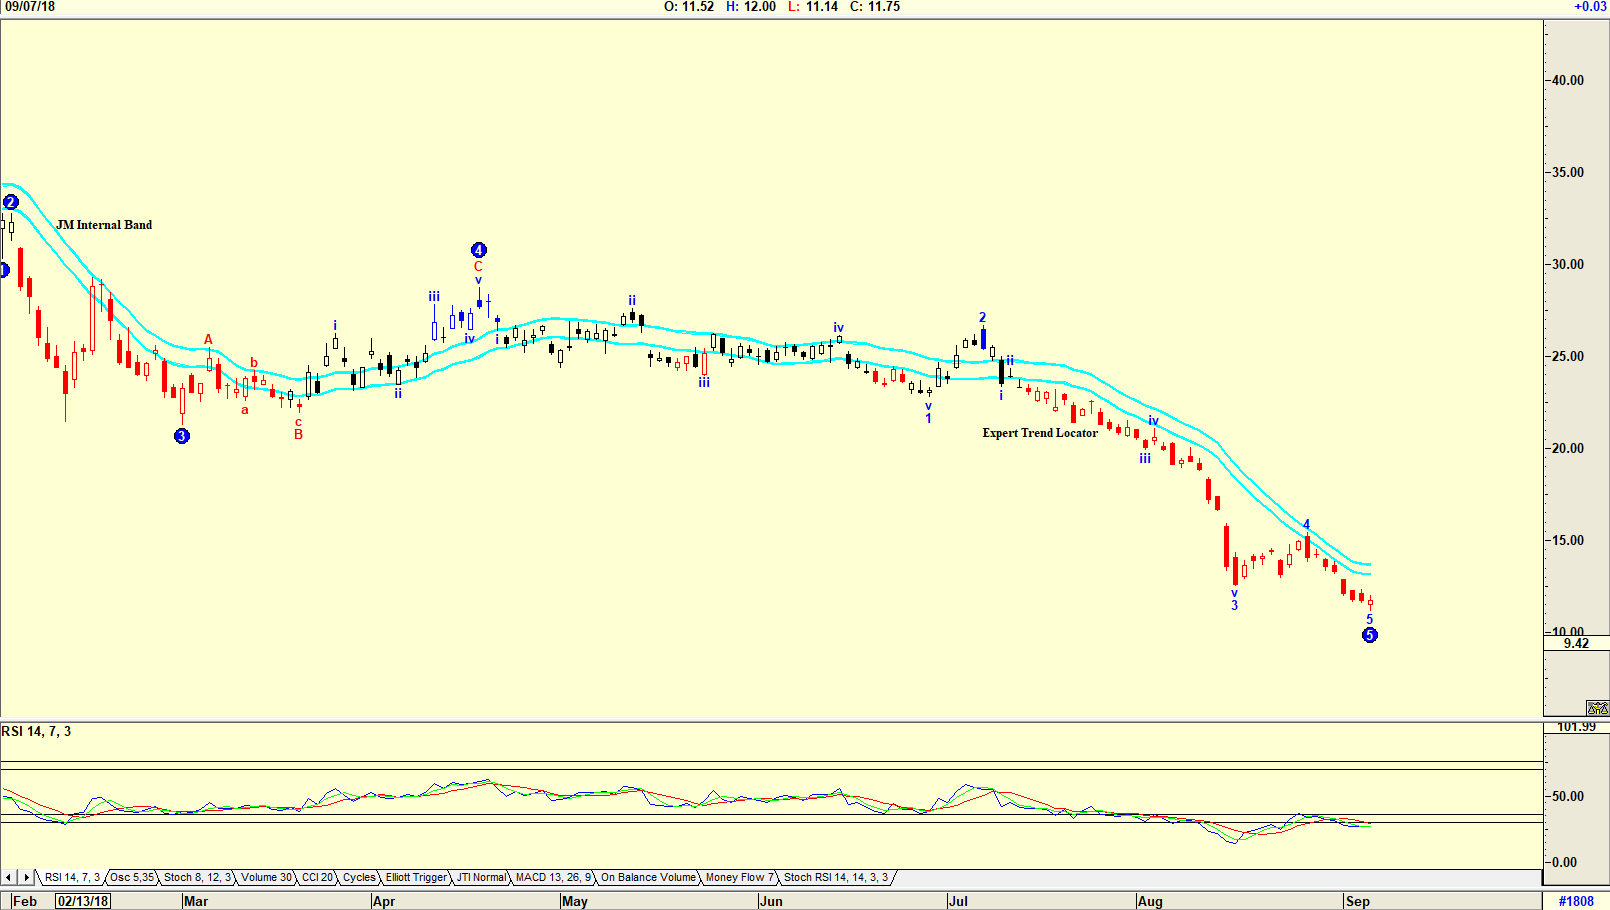
| Figure 2. Daily chart of Direxion Gold Bull. |
| Graphic provided by: AdvancedGET. |
| |
| Looking at the daily chart of Direxion Gold Mining in Figure 2, an Elliott wave count is suggesting that a WAVE 5 correction has occurred. The Expert Trend Locator, an indicator offered by the Advanced GET program, is still red, suggesting that the price could fall further. The Expert Trend Locator is a study developed by Tom Joseph. He developed it so that it uses a statistical evaluation of the stock market that can tell the difference between random market swings (noise) and directed market swings (trends). Do note the RSI indicator which has started trending up, suggesting that a buy could be given in the near future. |

|
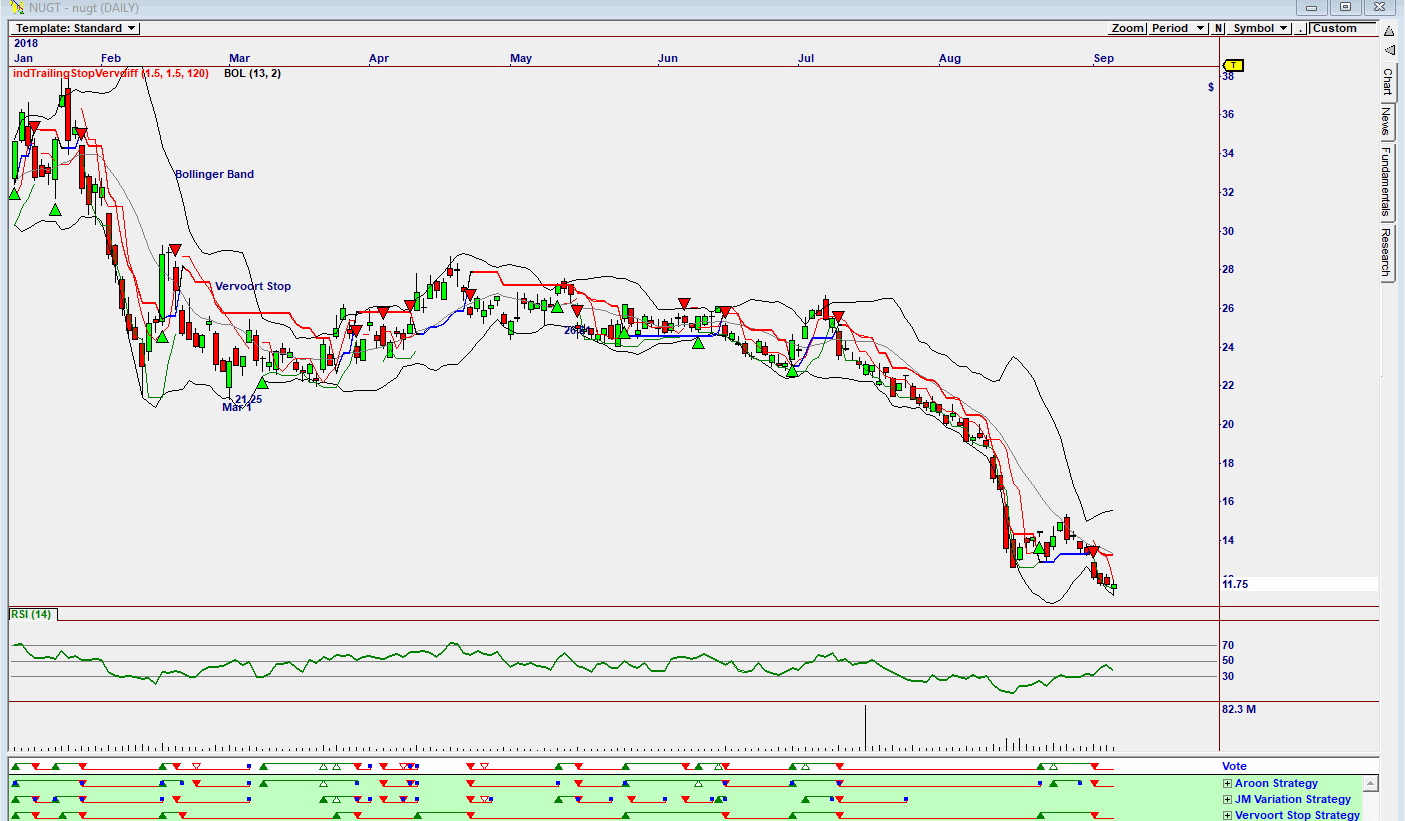
| Figure 3. Daily Omnitrader Chart of Direxion Gold Bull. |
| Graphic provided by: Omnitrader. |
| |
| The Omnitrader Chart in Figure 3 is still suggesting a downtrend with the trigger on the Vote line based on the Aroon and Vervoort strategies. Is the movement of gold a signal that the market could correct in the future? Will gold shares still be a hedge against a strong market correction? Personally, I believe that it is far safer to invest in gold shares rather than buy Bitcoin. Patience, and studying charts, without falling asleep as a speech is given, can provide the answer. |
Has been a technical analyst since 1969, and has worked as a futures and options trader with First Financial Futures in Johannesburg, South Africa.
| Address: | 3256 West 24th Ave |
| Vancouver, BC | |
| Phone # for sales: | 6042634214 |
| E-mail address: | petroosp@gmail.com |
Click here for more information about our publications!
Comments
Date: 09/22/18Rank: 4Comment:

Request Information From Our Sponsors
- StockCharts.com, Inc.
- Candle Patterns
- Candlestick Charting Explained
- Intermarket Technical Analysis
- John Murphy on Chart Analysis
- John Murphy's Chart Pattern Recognition
- John Murphy's Market Message
- MurphyExplainsMarketAnalysis-Intermarket Analysis
- MurphyExplainsMarketAnalysis-Visual Analysis
- StockCharts.com
- Technical Analysis of the Financial Markets
- The Visual Investor
- VectorVest, Inc.
- Executive Premier Workshop
- One-Day Options Course
- OptionsPro
- Retirement Income Workshop
- Sure-Fire Trading Systems (VectorVest, Inc.)
- Trading as a Business Workshop
- VectorVest 7 EOD
- VectorVest 7 RealTime/IntraDay
- VectorVest AutoTester
- VectorVest Educational Services
- VectorVest OnLine
- VectorVest Options Analyzer
- VectorVest ProGraphics v6.0
- VectorVest ProTrader 7
- VectorVest RealTime Derby Tool
- VectorVest Simulator
- VectorVest Variator
- VectorVest Watchdog
