HOT TOPICS LIST
- MACD
- Fibonacci
- RSI
- Gann
- ADXR
- Stochastics
- Volume
- Triangles
- Futures
- Cycles
- Volatility
- ZIGZAG
- MESA
- Retracement
- Aroon
INDICATORS LIST
LIST OF TOPICS
PRINT THIS ARTICLE
by David Penn
Both corporates and Treasuries look primed for corrections.
Position: N/A
David Penn
Technical Writer for Technical Analysis of STOCKS & COMMODITIES magazine, Working-Money.com, and Traders.com Advantage.
PRINT THIS ARTICLE
REVERSAL
Troublesome Tops for Bonds
12/17/02 08:45:15 AMby David Penn
Both corporates and Treasuries look primed for corrections.
Position: N/A
| Among the myriad equities-based iShares options, a new set of fixed income based iShares have become increasingly available. Tracking corporate bonds as well as Treasuries, these iShares were developed as a way for retail investors to take advantage of the secular bull market in bonds, a secular bull market that has rivaled even that of the secular bull market in stocks. Save for the bond bear markets in 1983-84, the correction in the second half of 1987, market softness from 1993-94, and a massive asset allocation shift from bonds to stocks during the stock market mania blow-off from 1998 to 2000, bonds have been a great steady investment gainer for years. I've noted the bear markets and corrections, with approximations based on continuous futures of the 10-year Treasury note: May 1983 to May 1984 24 '26 to 15 '17 March 1987 to October 1987 56 '06 to 48 '27 October 1993 to November 1994 84 '07 to 73 '08 October 1998 to January 2000 98 '19 to 85 '11 |
| So while the question of how long stocks will continue to rise has been demonstrably answered, the question of how long bonds will remain a relatively safe haven for investors remains an open one. Unfortunately, from a technical perspective, it looks as if the response to that question--at least in the intermediate term of weeks to months, is likely to be "not much longer." |

|
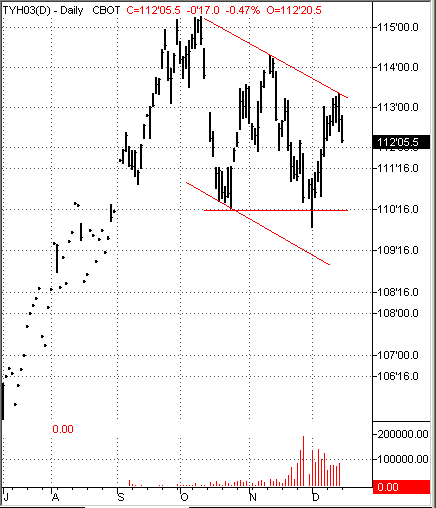
| Figure 1: Neither a trend channel nor a true descending triangle, the March T-note nonetheless looks increasingly bearish. |
| Graphic provided by: TradeStation. |
| |
| Looking first at Treasuries, I am impressed by the notion that the March 10-year T-note has yet to take out the high of 114 '23 established after the July rally. Not only have Treasuries failed to do this, but also they have failed to take out the high of 113 '29 established after the October rally. This development of lower highs is the first danger signal that higher ground will be harder to both take and keep. Currently, the March 10-year is correcting from another post-July peak made in mid-December, a peak that was as high as 113--and that on a bearish reversal bar (see Figure 1). The trough between the December and October peaks was only marginally lower than the trough between the October and July peaks (110 '2.5 versus 110 '22). But the lower highs clearly threaten any continued advance in price. |
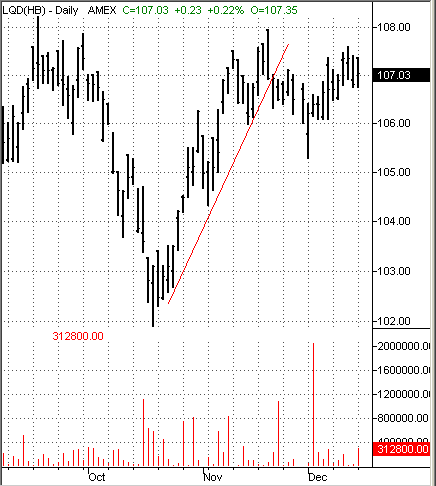
 Figure 2: Failure to take out previous highs could mean that this December advance is merely a prelude to a correction. A look at the corporate side of the bond world also suggests selling pressure may increase over the intermediate term. For simplicity, I used the iShare LQD, which mirrors the price movement of the Goldman Sachs' trademarked InvesTop Index. This iShare thus reflects corporate debt with an average maturity of 10 years and an average coupon or interest rate of about 6.3% Top holdings in the index include corporate bonds from British Telecommunications, Daimler Chrysler, Bank of America and Devon Energy Company, among many others. The iShare itself is relatively new, but the index it tracks has turned in a three-year annualized return of 7.96% (marked to month; 8.12% marked to quarter). While somewhat less over a five-year period (3.94%, marked to month), the three-year period well characterizes the performance of bonds since the equities market peaked, when money increasingly began flowing into bonds and bond funds. |
| Technically, however, corporate bonds--seen through the lens of iShare LQD--look due for a correction. LQD has yet to exceed the high of 108.23 from September 17th. Its most recent attempt came at the end of the mid-October to mid-November rally, which peaked out at 107.93. Equally important, the price correction that followed this one-month, short-term rally broke through the rally's up trendline, finally reaching a correction bottom of 105.30 late in November. LQD rallied from this point, but its advance has been sluggish. Failure of LQD to, at a minimum, take out the mid-November high of 107.93, would be the clearest sign of weakness since the initial trendline break. If LQD does correct, then what sort of downside might be watched for? The most basic measurement--the swing rule--would suggest that the distance between the most recent correction low and the most recent rally high measures the distance of any breakdown beneath the most recent correction low. Taking 107.93 as the high and 105.30 as the low, the difference of 2.63 points to a downside of 102.67--and a likely test of the October lows at 101.90. |
Technical Writer for Technical Analysis of STOCKS & COMMODITIES magazine, Working-Money.com, and Traders.com Advantage.
| Title: | Technical Writer |
| Company: | Technical Analysis, Inc. |
| Address: | 4757 California Avenue SW |
| Seattle, WA 98116 | |
| Phone # for sales: | 206 938 0570 |
| Fax: | 206 938 1307 |
| Website: | www.Traders.com |
| E-mail address: | DPenn@traders.com |
Traders' Resource Links | |
| Charting the Stock Market: The Wyckoff Method -- Books | |
| Working-Money.com -- Online Trading Services | |
| Traders.com Advantage -- Online Trading Services | |
| Technical Analysis of Stocks & Commodities -- Publications and Newsletters | |
| Working Money, at Working-Money.com -- Publications and Newsletters | |
| Traders.com Advantage -- Publications and Newsletters | |
| Professional Traders Starter Kit -- Software | |
Click here for more information about our publications!
Comments
Date: 12/18/02Rank: 5Comment:
Date: 12/19/02Rank: 4Comment:
Date: 12/24/02Rank: 4Comment:

Request Information From Our Sponsors
- StockCharts.com, Inc.
- Candle Patterns
- Candlestick Charting Explained
- Intermarket Technical Analysis
- John Murphy on Chart Analysis
- John Murphy's Chart Pattern Recognition
- John Murphy's Market Message
- MurphyExplainsMarketAnalysis-Intermarket Analysis
- MurphyExplainsMarketAnalysis-Visual Analysis
- StockCharts.com
- Technical Analysis of the Financial Markets
- The Visual Investor
- VectorVest, Inc.
- Executive Premier Workshop
- One-Day Options Course
- OptionsPro
- Retirement Income Workshop
- Sure-Fire Trading Systems (VectorVest, Inc.)
- Trading as a Business Workshop
- VectorVest 7 EOD
- VectorVest 7 RealTime/IntraDay
- VectorVest AutoTester
- VectorVest Educational Services
- VectorVest OnLine
- VectorVest Options Analyzer
- VectorVest ProGraphics v6.0
- VectorVest ProTrader 7
- VectorVest RealTime Derby Tool
- VectorVest Simulator
- VectorVest Variator
- VectorVest Watchdog
