HOT TOPICS LIST
- MACD
- Fibonacci
- RSI
- Gann
- ADXR
- Stochastics
- Volume
- Triangles
- Futures
- Cycles
- Volatility
- ZIGZAG
- MESA
- Retracement
- Aroon
INDICATORS LIST
LIST OF TOPICS
PRINT THIS ARTICLE
by Koos van der Merwe
President Donald Trump announced that if he is impeached the stock market will crash.
Position: Sell
Koos van der Merwe
Has been a technical analyst since 1969, and has worked as a futures and options trader with First Financial Futures in Johannesburg, South Africa.
PRINT THIS ARTICLE
ELLIOTT WAVE
Impeach And Crash
09/13/18 04:52:14 PMby Koos van der Merwe
President Donald Trump announced that if he is impeached the stock market will crash.
Position: Sell
| The past few weeks have seen Michael Cohen and Paul Manafort found guilty. Most damaging is the confession by Cohen and the establishment of a direct link to corruption charges in naming President Trump as the instigator. Section Four of Article Two of the United States Constitution states unequivocally: "The president, vice-president and all civil officers of the United States, shall be removed from office on impeachment for, and conviction of, treason, bribery, or other high crimes and misdemeanors." President Trump, on hearing this, immediately announced that should he be impeached the stock market will crash. My charts have been anticipating a crash for over a year now. Is a possible impeachment the trigger? |

|
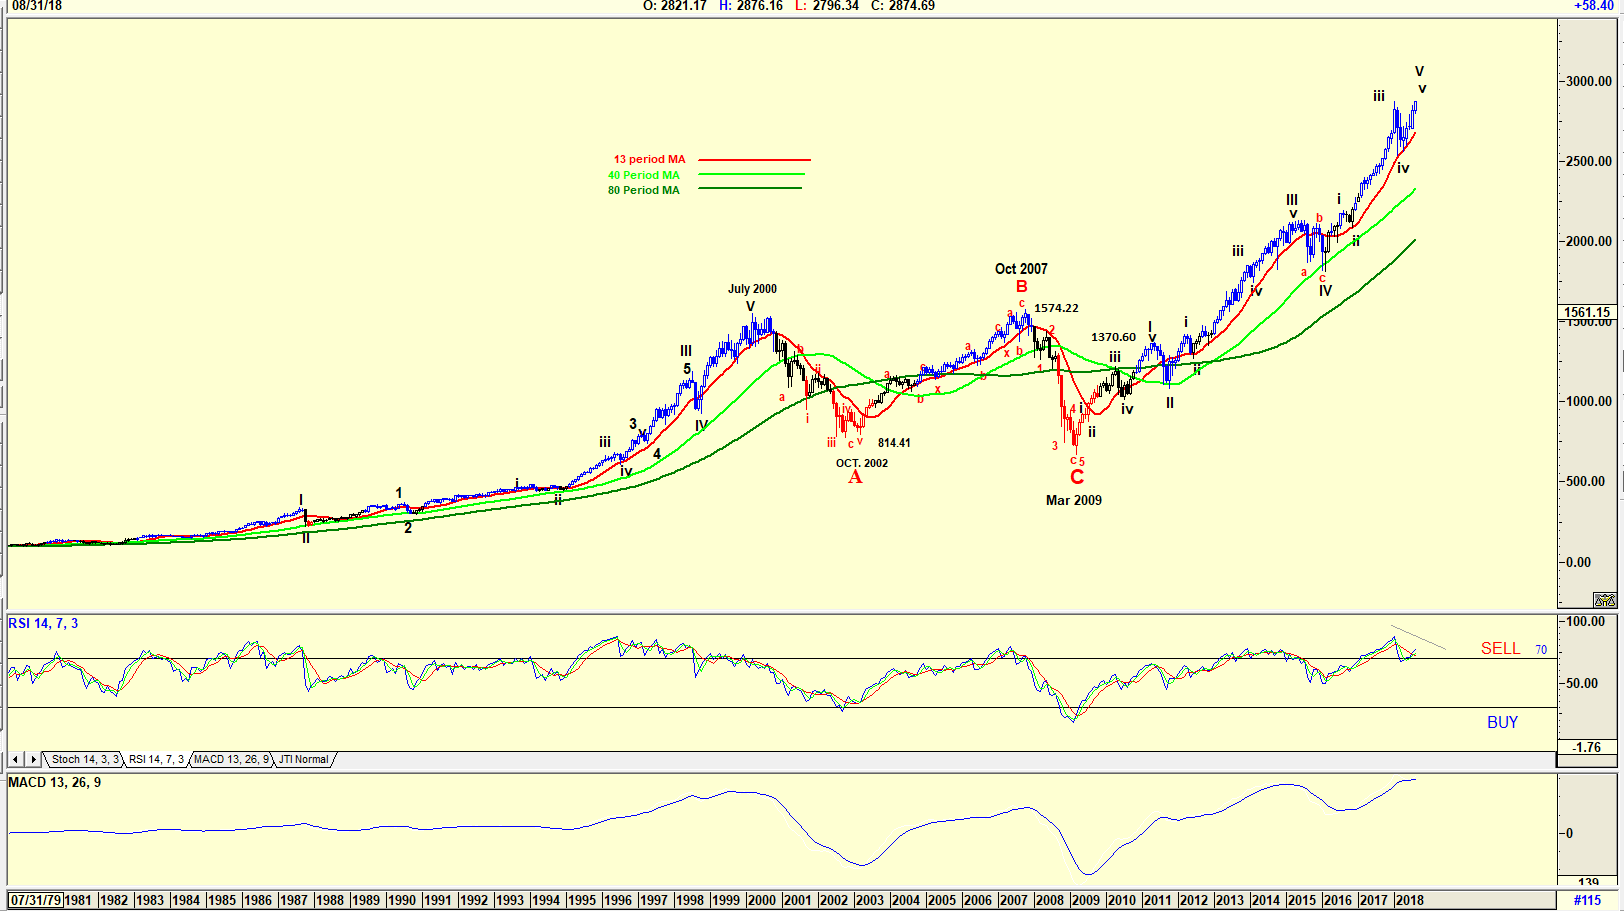
| Figure 1. Monthly chart of S&P 500 Index. |
| Graphic provided by: AdvancedGET. |
| |
| The chart in Figure 1 is a monthly chart of the S&P 500 Index. An Elliott wave count suggests that the index is tracing a wave v of WAVE V. The RSI Index shows that a possible divergence sell could be forming. A divergence sell is where a lower high is formed before the RSI breaks below the 70 horizontal suggesting a sell. The MACD indicator has also suggested a sell. An MACD indicator is a very conservative indicator and usually confirms an RSI sell signal. A move below the 13-period moving average will be a positive confirmation. |

|
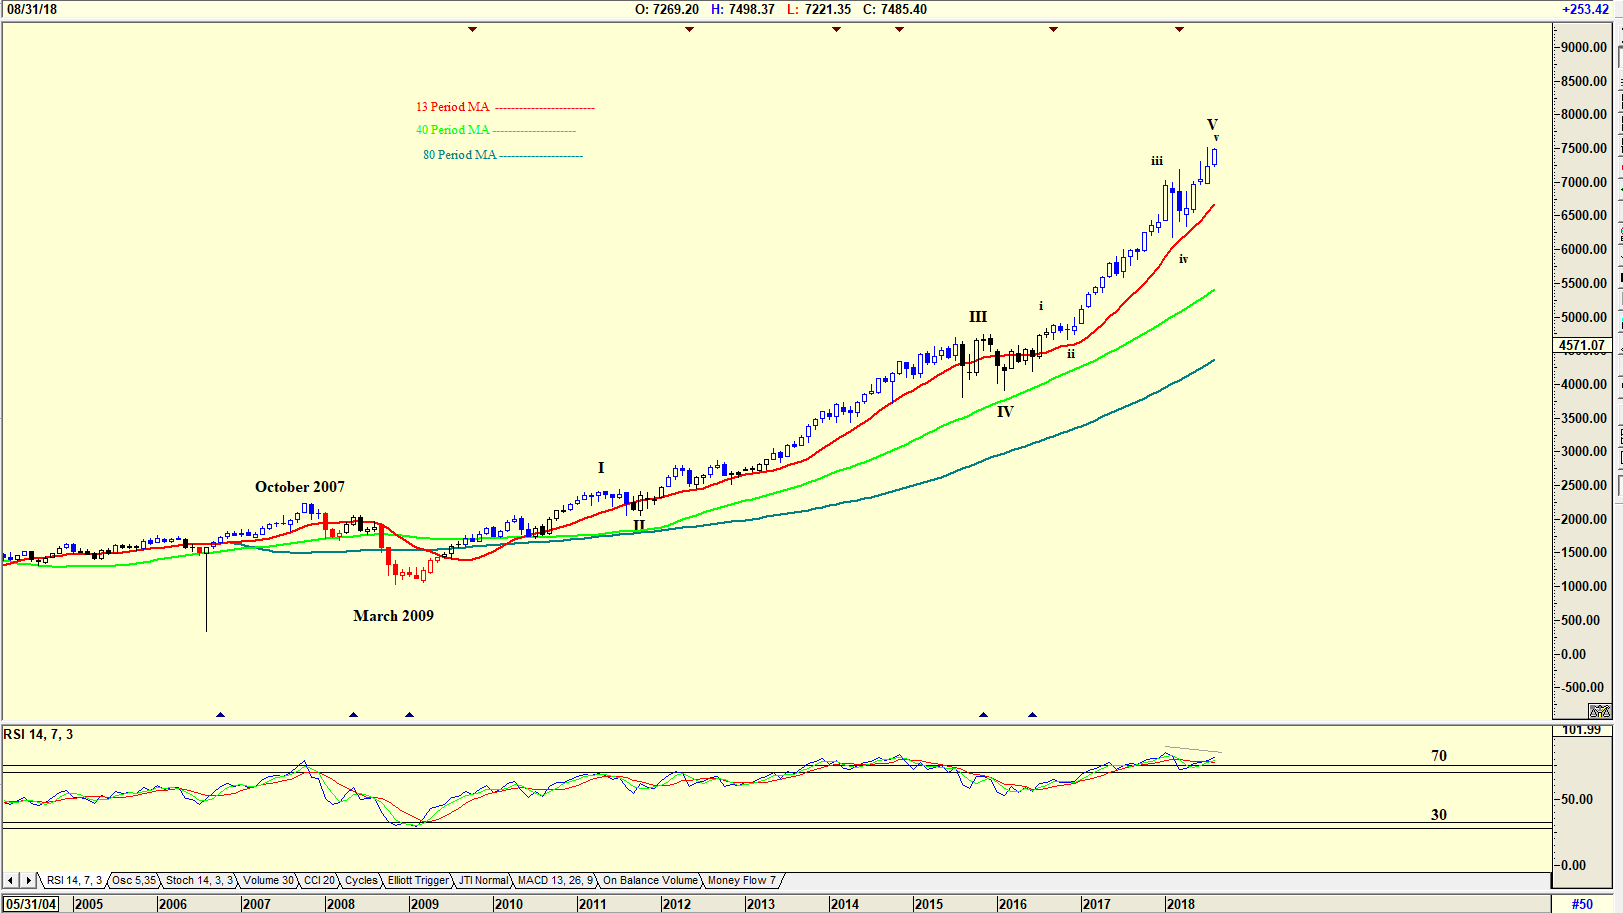
| Figure 2. Monthly chart of Nasdaq Index. |
| Graphic provided by: AdvancedGET. |
| |
| The chart in Figure 2 is a monthly chart of the Nasdaq Index with a pattern from the year 2001 that is similar to the S&P 500 Monthly index from 2007. The chart is suggesting a WAVE V top is occurring. Once again, the RSI Index could be tracing a divergence sell. |

|
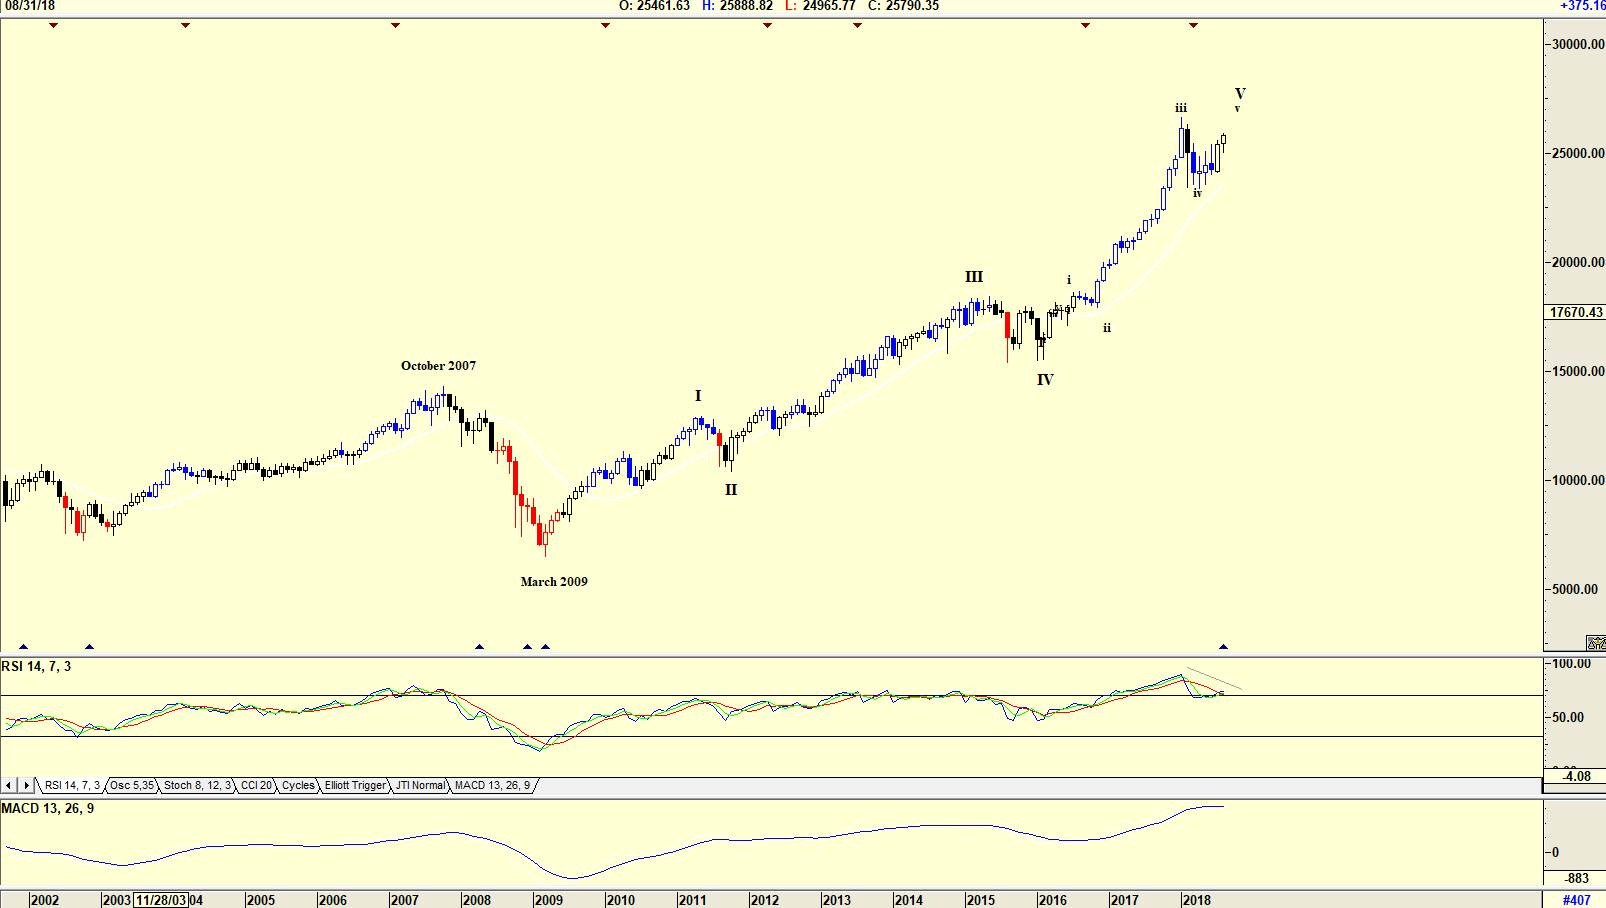
| Figure 3. Monthly chart of Dow Jones Index. |
| Graphic provided by: AdvancedGET. |
| |
| The chart in Figure 3 is a chart of the Dow Jones showing an Elliott wave count similar to the charts in Figure 1 and Figure 2. The RSI indicator is once again suggesting a future divergence sell. The MACD indicator has suggested a sell signal. |

|
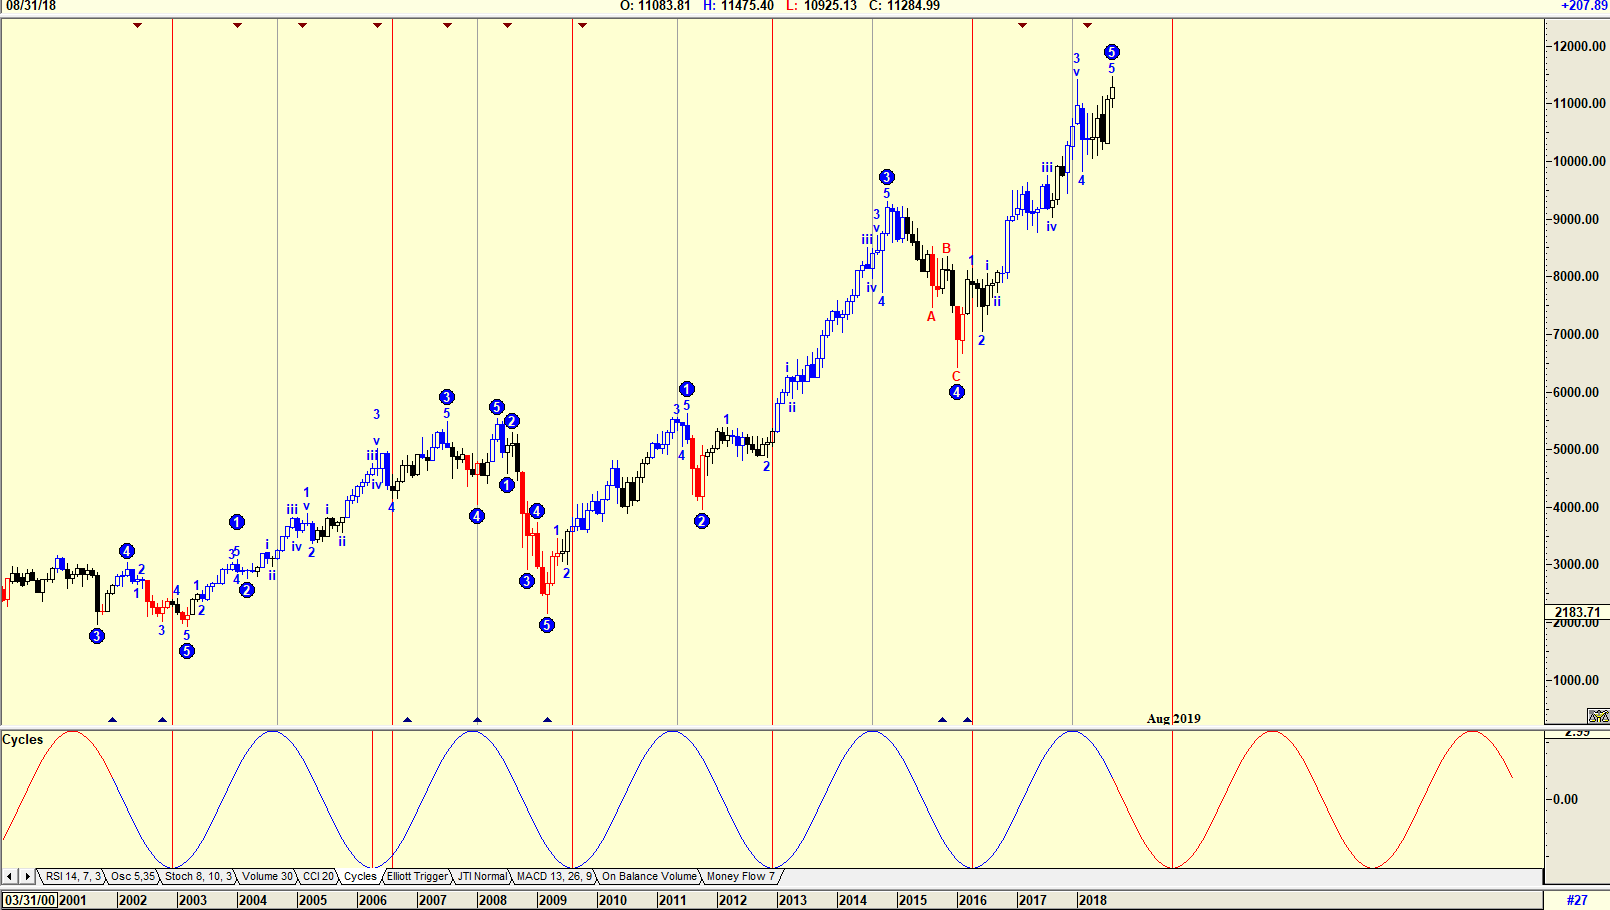
| Figure 4. Monthly chart of Dow Transportation Index. |
| Graphic provided by: AdvancedGET. |
| |
| The chart in Figure 4 is a monthly chart of the Dow Transportation Index showing the cycle index which is suggesting that the trend should be down. Once again, the index is completing an Elliott WAVE 5. All the major Indexes are suggesting that a top is forming, and that a correction is around the corner. Whether the final trigger will be the legal trials building against those who were confidants to President Trump, or whether it will occur if and when impeachment proceeding will occur is unknown. Whatever the outcome, a correction is about to occur. With October, the month most crashes happen just around the corner, caution is necessary. Never forget, CASH is KING. |
Has been a technical analyst since 1969, and has worked as a futures and options trader with First Financial Futures in Johannesburg, South Africa.
| Address: | 3256 West 24th Ave |
| Vancouver, BC | |
| Phone # for sales: | 6042634214 |
| E-mail address: | petroosp@gmail.com |
Click here for more information about our publications!
PRINT THIS ARTICLE

Request Information From Our Sponsors
- VectorVest, Inc.
- Executive Premier Workshop
- One-Day Options Course
- OptionsPro
- Retirement Income Workshop
- Sure-Fire Trading Systems (VectorVest, Inc.)
- Trading as a Business Workshop
- VectorVest 7 EOD
- VectorVest 7 RealTime/IntraDay
- VectorVest AutoTester
- VectorVest Educational Services
- VectorVest OnLine
- VectorVest Options Analyzer
- VectorVest ProGraphics v6.0
- VectorVest ProTrader 7
- VectorVest RealTime Derby Tool
- VectorVest Simulator
- VectorVest Variator
- VectorVest Watchdog
- StockCharts.com, Inc.
- Candle Patterns
- Candlestick Charting Explained
- Intermarket Technical Analysis
- John Murphy on Chart Analysis
- John Murphy's Chart Pattern Recognition
- John Murphy's Market Message
- MurphyExplainsMarketAnalysis-Intermarket Analysis
- MurphyExplainsMarketAnalysis-Visual Analysis
- StockCharts.com
- Technical Analysis of the Financial Markets
- The Visual Investor
