HOT TOPICS LIST
- MACD
- Fibonacci
- RSI
- Gann
- ADXR
- Stochastics
- Volume
- Triangles
- Futures
- Cycles
- Volatility
- ZIGZAG
- MESA
- Retracement
- Aroon
INDICATORS LIST
LIST OF TOPICS
PRINT THIS ARTICLE
by Koos van der Merwe
With all the uncertainty occurring in the USA today, do you stand aside?
Position: Buy
Koos van der Merwe
Has been a technical analyst since 1969, and has worked as a futures and options trader with First Financial Futures in Johannesburg, South Africa.
PRINT THIS ARTICLE
TECHNICAL ANALYSIS
Using A Strategy
08/30/18 04:38:54 PMby Koos van der Merwe
With all the uncertainty occurring in the USA today, do you stand aside?
Position: Buy
| With the tariffs threatened on China, and China's retaliation; with the Mueller investigation approaching finality; with the Manafort trial capturing everyone's attention, and President Trump calling the trial "very sad"; with all this news on television and newspapers casting problems on what is affecting the market, "Is the market going up or is it going down?" One has only to remember Thursday, August 16, when the Dow rose by 313 points and continued rising on Friday the 17th to a high of 25728.16. One asks "Why? Why the strength in the market? Is it time to start buying stocks again? If yes, what stocks?" After Friday's market close, using the market strategy I use, to highlight stocks to watch, 109 stocks out of the 2057 stocks in the US and Canadian markets suggested buy signals. Does one buy them? If you are as scared of the market as I am, then the answer is "go for income." In other words, buy and hold a stock that pays you a comfortable dividend or interest, or simply stay in cash and let your bank pay you interest. |

|
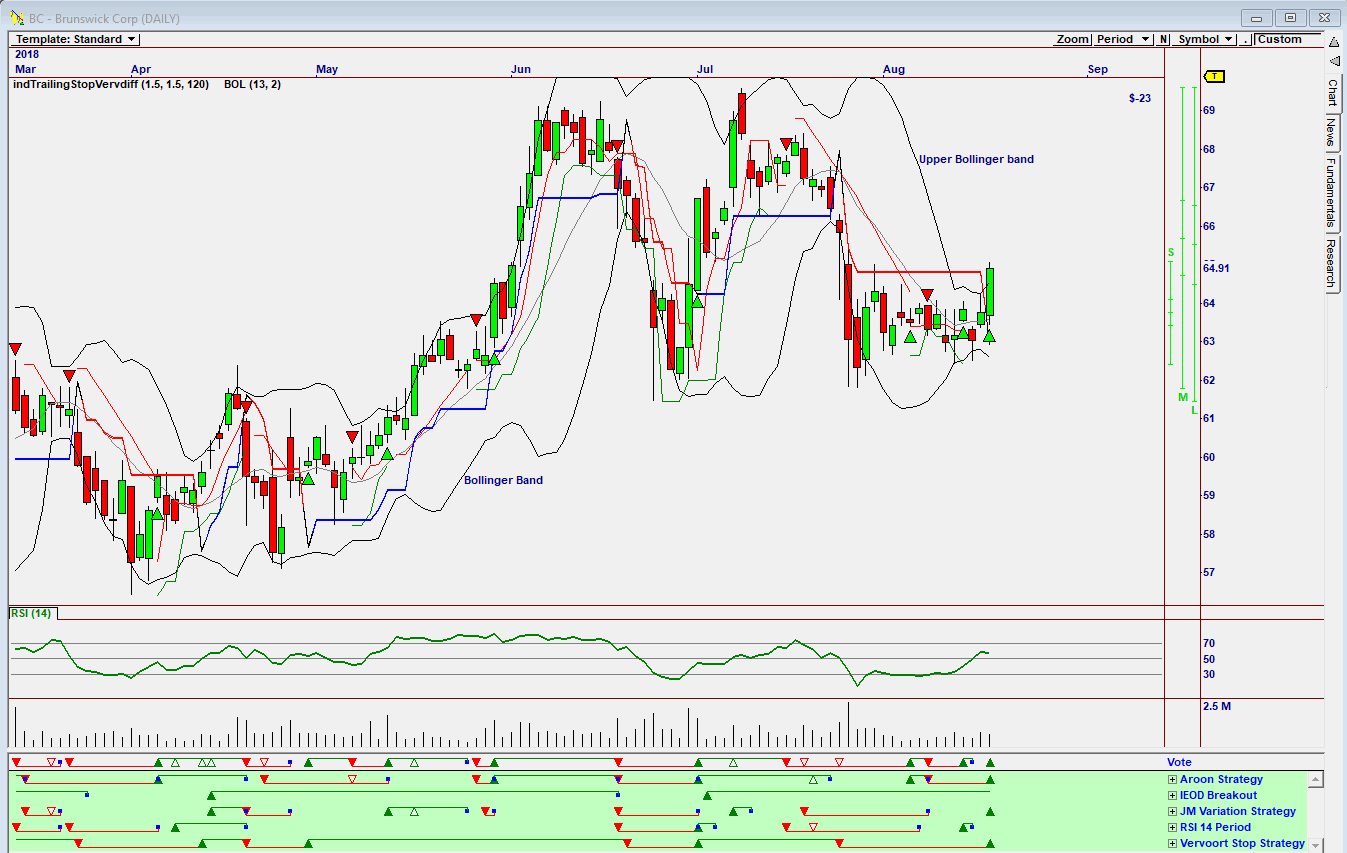
| Figure 1. Daily chart of Brunswick Corp. |
| Graphic provided by: Omnitrader. |
| |
| Looking at one of the American stocks (BC) that gave me a buy signal on Friday's market, if you look at the chart in Figure 1, you will see that the buy signal on the Vote line was triggered by the Aroon Strategy, the JM Variation strategy and the Vervoort Stop Strategy. Most times capital gains are more profitable than waiting for an interest payment, so one could do a buy and sell on the next rise in the stock or wait for the Vote line to trigger a sell. |

|
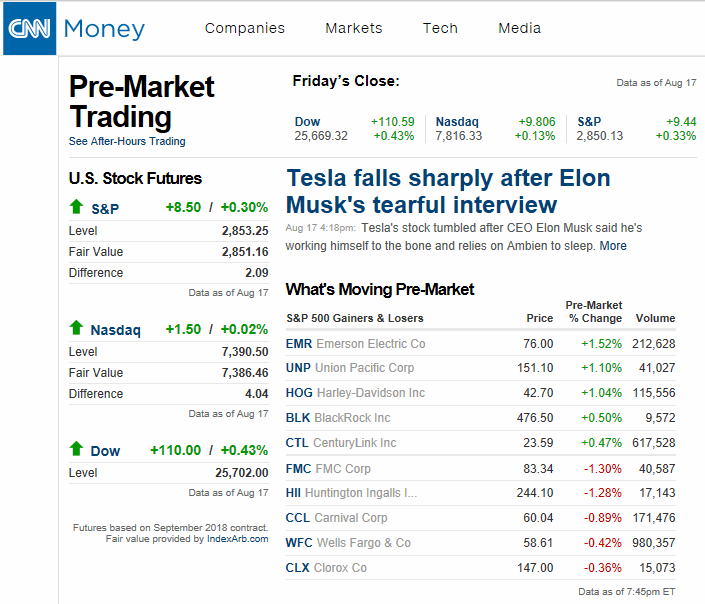
| Figure 2. CNN Money Pre-Market Trading. |
| Graphic provided by: Google. |
| |
| Of course there is another strategy one could use if one prefers holding a stock for 30 minutes or less, and that is looking at those shares that fell strongly and buying on the correction and selling after 5 to 15 minutes. The chart in Figure 2 is a chart of the web site CNN Money, and shows those shares moving pre-market. So before the market opens, you look at charts of those shares that have fallen, and place a buy order selling as the stock corrects upwards. |

|
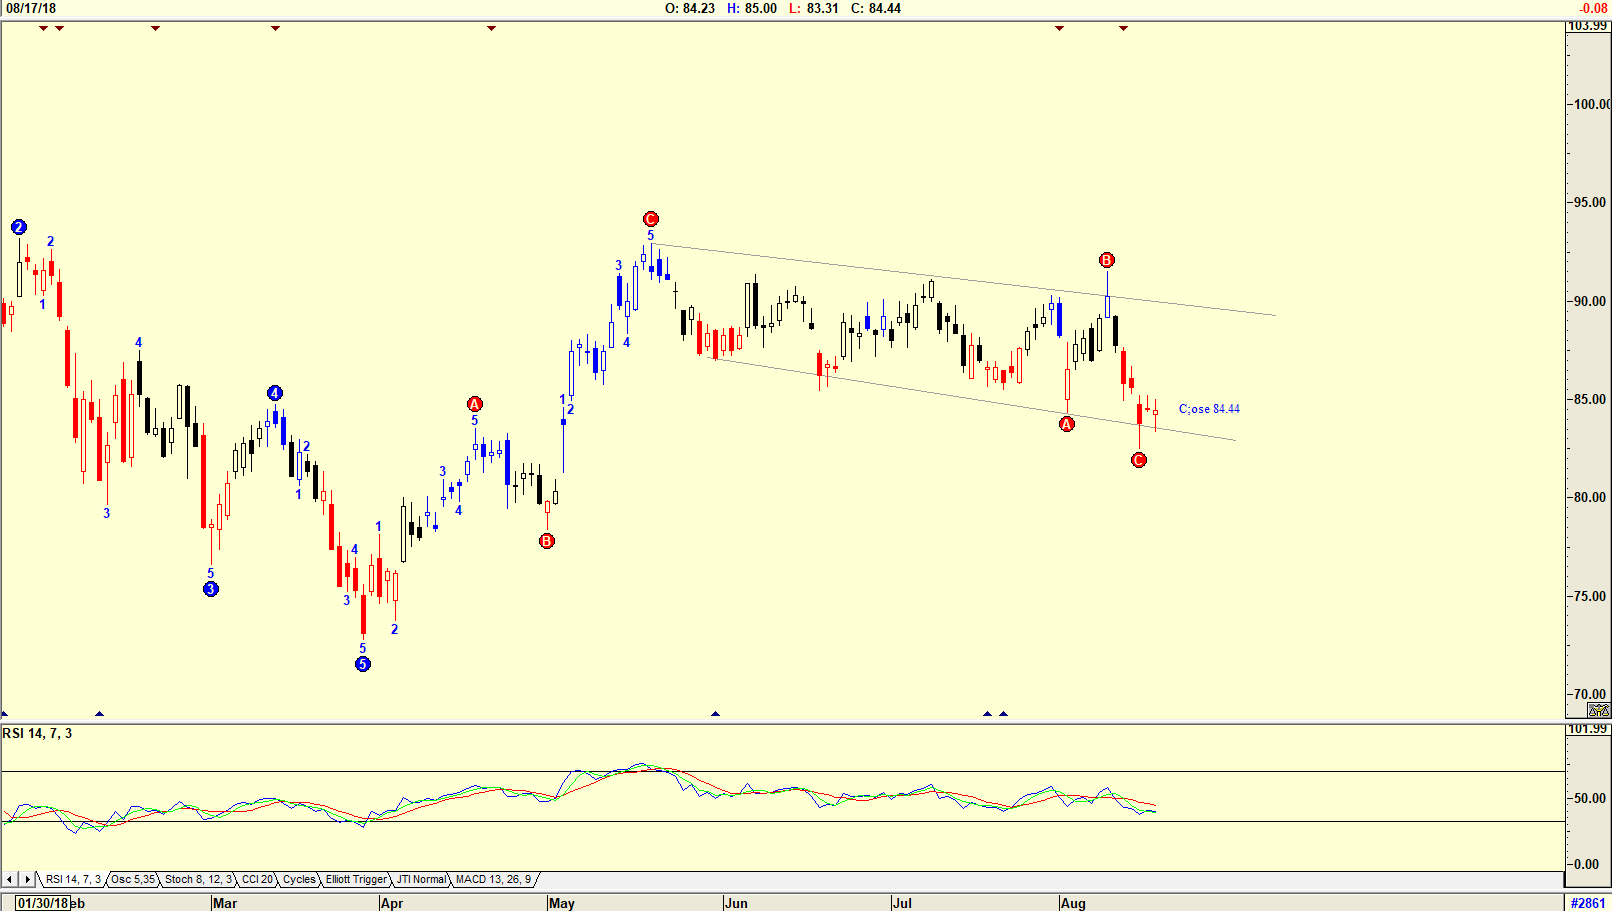
| Figure 3. FMC Corp. |
| Graphic provided by: AdvancedGET. |
| |
| The chart in Figure 3 is a daily chart of FMC Corp showing how the share price traded on Friday, August 17. The share closed at $84.44. The candlestick pattern does suggest that the stock could rise as the market opens. The fact that the lower trend line is being tested is also a sign of a possible rise. However, the RSI indicator is trending down, so a long-term hold is not there. |
| I would suggest paper trading the strategy until one becomes happy with it. Daily profits are far better than buy and hold for interest or dividends. |
Has been a technical analyst since 1969, and has worked as a futures and options trader with First Financial Futures in Johannesburg, South Africa.
| Address: | 3256 West 24th Ave |
| Vancouver, BC | |
| Phone # for sales: | 6042634214 |
| E-mail address: | petroosp@gmail.com |
Click here for more information about our publications!
PRINT THIS ARTICLE

Request Information From Our Sponsors
- StockCharts.com, Inc.
- Candle Patterns
- Candlestick Charting Explained
- Intermarket Technical Analysis
- John Murphy on Chart Analysis
- John Murphy's Chart Pattern Recognition
- John Murphy's Market Message
- MurphyExplainsMarketAnalysis-Intermarket Analysis
- MurphyExplainsMarketAnalysis-Visual Analysis
- StockCharts.com
- Technical Analysis of the Financial Markets
- The Visual Investor
- VectorVest, Inc.
- Executive Premier Workshop
- One-Day Options Course
- OptionsPro
- Retirement Income Workshop
- Sure-Fire Trading Systems (VectorVest, Inc.)
- Trading as a Business Workshop
- VectorVest 7 EOD
- VectorVest 7 RealTime/IntraDay
- VectorVest AutoTester
- VectorVest Educational Services
- VectorVest OnLine
- VectorVest Options Analyzer
- VectorVest ProGraphics v6.0
- VectorVest ProTrader 7
- VectorVest RealTime Derby Tool
- VectorVest Simulator
- VectorVest Variator
- VectorVest Watchdog
