HOT TOPICS LIST
- MACD
- Fibonacci
- RSI
- Gann
- ADXR
- Stochastics
- Volume
- Triangles
- Futures
- Cycles
- Volatility
- ZIGZAG
- MESA
- Retracement
- Aroon
INDICATORS LIST
LIST OF TOPICS
PRINT THIS ARTICLE
by Koos van der Merwe
With the American political agenda creating so much uncertainty in the stock market, what is the best indicator to watch?
Position: Sell
Koos van der Merwe
Has been a technical analyst since 1969, and has worked as a futures and options trader with First Financial Futures in Johannesburg, South Africa.
PRINT THIS ARTICLE
TECHNICAL ANALYSIS
Looking For The Best
08/23/18 04:34:09 PMby Koos van der Merwe
With the American political agenda creating so much uncertainty in the stock market, what is the best indicator to watch?
Position: Sell
| The air is full of news about President Trump creating new tariffs. Whether America is increasing tariffs on China; negotiating a new NAFTA agreement with Mexico but ignoring Canada; or whatever happens tomorrow, whether fake news or true news, the stock market has more and more top financial advisors calling for a major market correction. Will it truly happen? Major indicators suggest that it could happen, the major question, of course, is when? Using a program with indicators that one has developed over the years and found successful, could be a guide. |

|
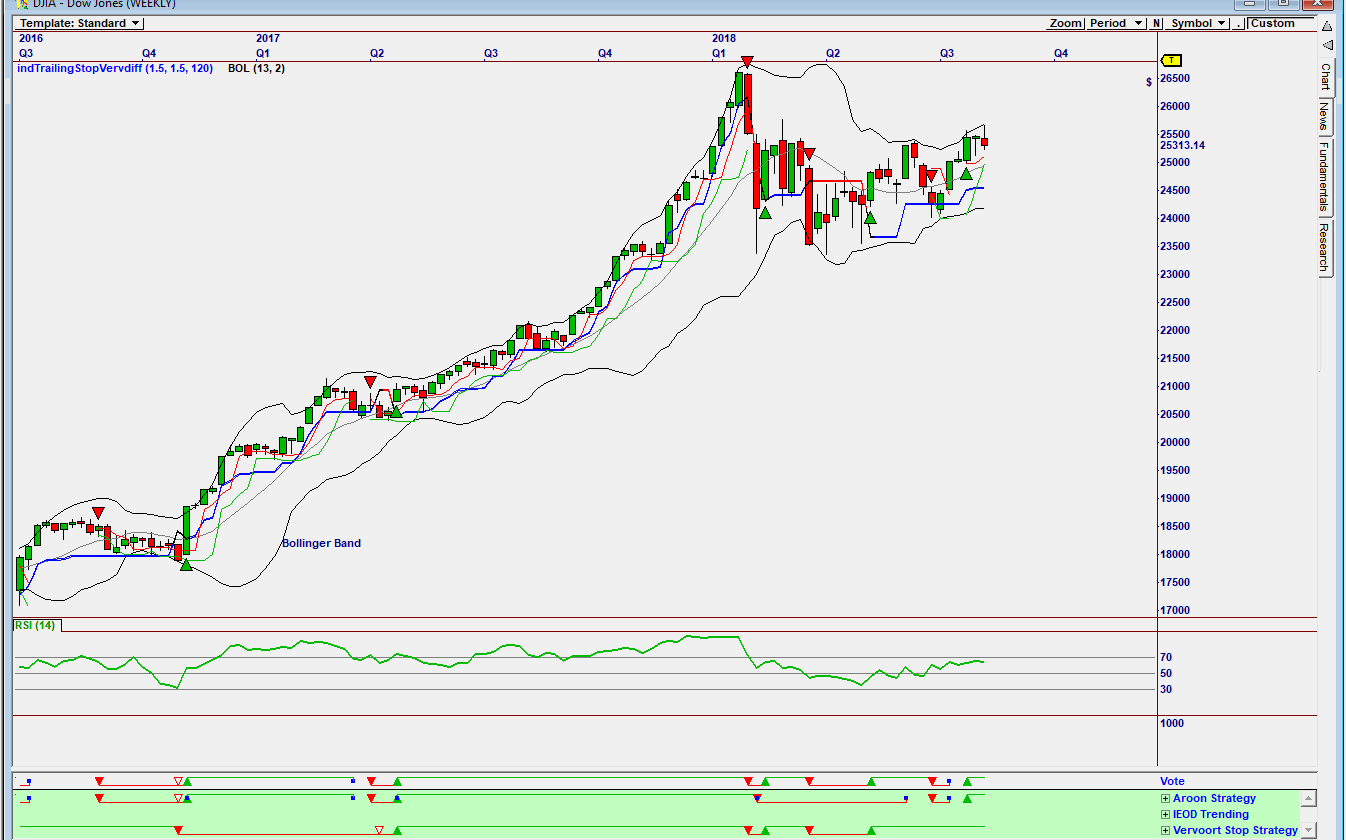
| Figure 1. Weekly chart of the Dow Jones. |
| Graphic provided by: Omnitrader. |
| |
| The chart in Figure 1 is an Omnitrader chart of the DOW showing the 5 strategies I have tested over many years and found successful in predicting a market movement. The chart is a weekly chart and the Vote line is suggesting a BUY based on the Aroon strategy. The weekly chart is suggesting that the Dow could still rise even though it is testing the upper Bollinger band. |

|
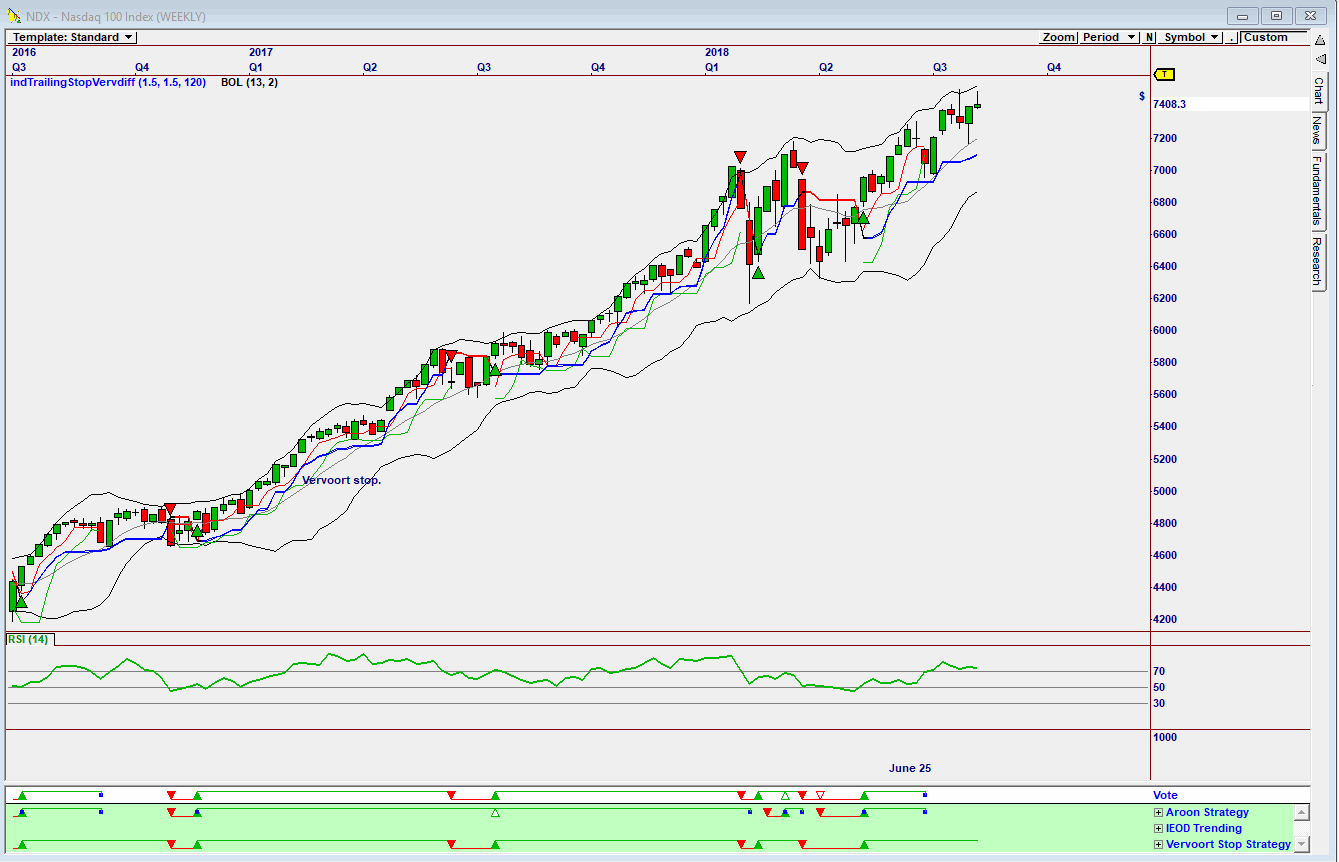
| Figure 2. Weekly chart of the Nasdaq 100 Index. |
| Graphic provided by: Omnitrader. |
| |
| Looking at a weekly chart of the Nasdaq 100 Index we see that the Vote line is blank, having stopped out the buy signal on June 25 based on the Aroon Strategy. Do note that the Vervoort stop strategy is still in buy mode. This is because the index did not fall below the Vervoort stop as shown on the chart. |

|
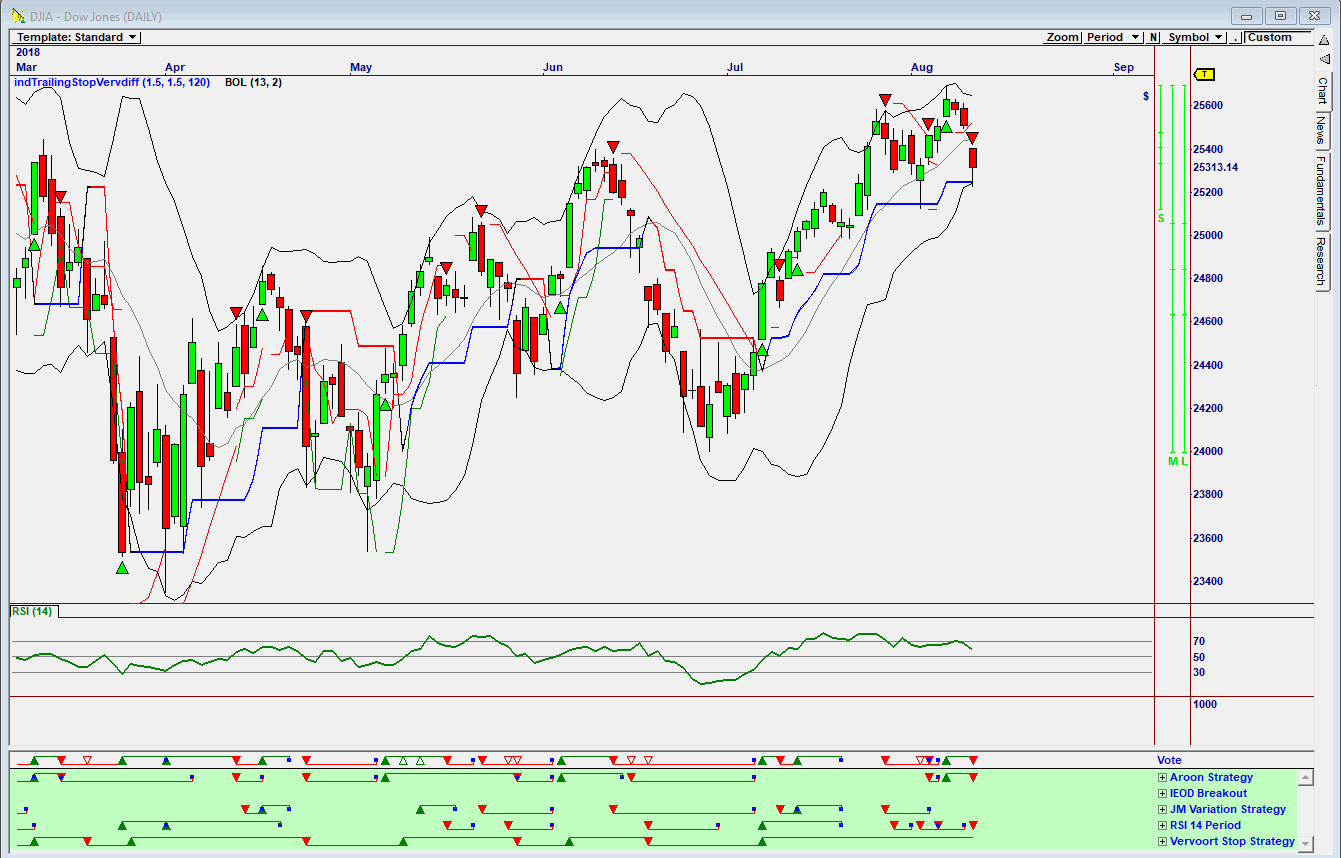
| Figure 3. Daily chart of the Dow Jones. |
| Graphic provided by: Omnitrader. |
| |
| So, accepting the strategies as the best I could develop, looking at a daily chart of the Dow Jones we can see that a sell signal has been triggered based on the RSI 14-period strategy. Does this mean that the Dow is correcting as forecast? Who knows, but caution is suggested. Following the indicators you have developed over the years can only lead to success in the long run. Looking at the above charts, is the correction that is anticipated about to happen? Who knows, but listening to the news every night does cause heartburn and bad indigestion. |
Has been a technical analyst since 1969, and has worked as a futures and options trader with First Financial Futures in Johannesburg, South Africa.
| Address: | 3256 West 24th Ave |
| Vancouver, BC | |
| Phone # for sales: | 6042634214 |
| E-mail address: | petroosp@gmail.com |
Click here for more information about our publications!
PRINT THIS ARTICLE

Request Information From Our Sponsors
- StockCharts.com, Inc.
- Candle Patterns
- Candlestick Charting Explained
- Intermarket Technical Analysis
- John Murphy on Chart Analysis
- John Murphy's Chart Pattern Recognition
- John Murphy's Market Message
- MurphyExplainsMarketAnalysis-Intermarket Analysis
- MurphyExplainsMarketAnalysis-Visual Analysis
- StockCharts.com
- Technical Analysis of the Financial Markets
- The Visual Investor
- VectorVest, Inc.
- Executive Premier Workshop
- One-Day Options Course
- OptionsPro
- Retirement Income Workshop
- Sure-Fire Trading Systems (VectorVest, Inc.)
- Trading as a Business Workshop
- VectorVest 7 EOD
- VectorVest 7 RealTime/IntraDay
- VectorVest AutoTester
- VectorVest Educational Services
- VectorVest OnLine
- VectorVest Options Analyzer
- VectorVest ProGraphics v6.0
- VectorVest ProTrader 7
- VectorVest RealTime Derby Tool
- VectorVest Simulator
- VectorVest Variator
- VectorVest Watchdog
