HOT TOPICS LIST
- MACD
- Fibonacci
- RSI
- Gann
- ADXR
- Stochastics
- Volume
- Triangles
- Futures
- Cycles
- Volatility
- ZIGZAG
- MESA
- Retracement
- Aroon
INDICATORS LIST
LIST OF TOPICS
PRINT THIS ARTICLE
by Koos van der Merwe
With technical analysis, could you have forecast the Facebook share crash?
Position: Sell
Koos van der Merwe
Has been a technical analyst since 1969, and has worked as a futures and options trader with First Financial Futures in Johannesburg, South Africa.
PRINT THIS ARTICLE
TECHNICAL ANALYSIS
Forecasting Facebook?
08/16/18 04:36:23 PMby Koos van der Merwe
With technical analysis, could you have forecast the Facebook share crash?
Position: Sell
| In one day, July 26, Facebook shares plunged from a high of $218.64 reached on July 25 to a low of $173.75. The $100 billion plus rout is the largest one-day loss in market value by any company in U.S. stock market history. The crash came after the company released a disastrous quarterly report. Three stocks, Intel, Microsoft and Apple, are stocks that in the past had large market cap losses, but Facebook's loss was 24% greater that Intel's loss, on September 22, 2000. Intel shed $90.74 billion in market value as the dot-com bubble burst. Earlier that year, on April 3, Microsoft lost $80 billion from its market cap in one day. With its challenge in reducing fake news and preventing hackers from accessing its website in spite of the numerous new controls that are coming into place, Facebook is facing an enormous challenge. The website is still one of the most social sites available, with users chatting with family and friends all over the world. Instagram and WhatsApp have attracted younger people, stalling Facebook usage growth this year. Earlier this year, the company announced that it would be installing changes that would slow growth and revenue. The share price did fall in February 2018, but recovered strongly from the end of March. |

|
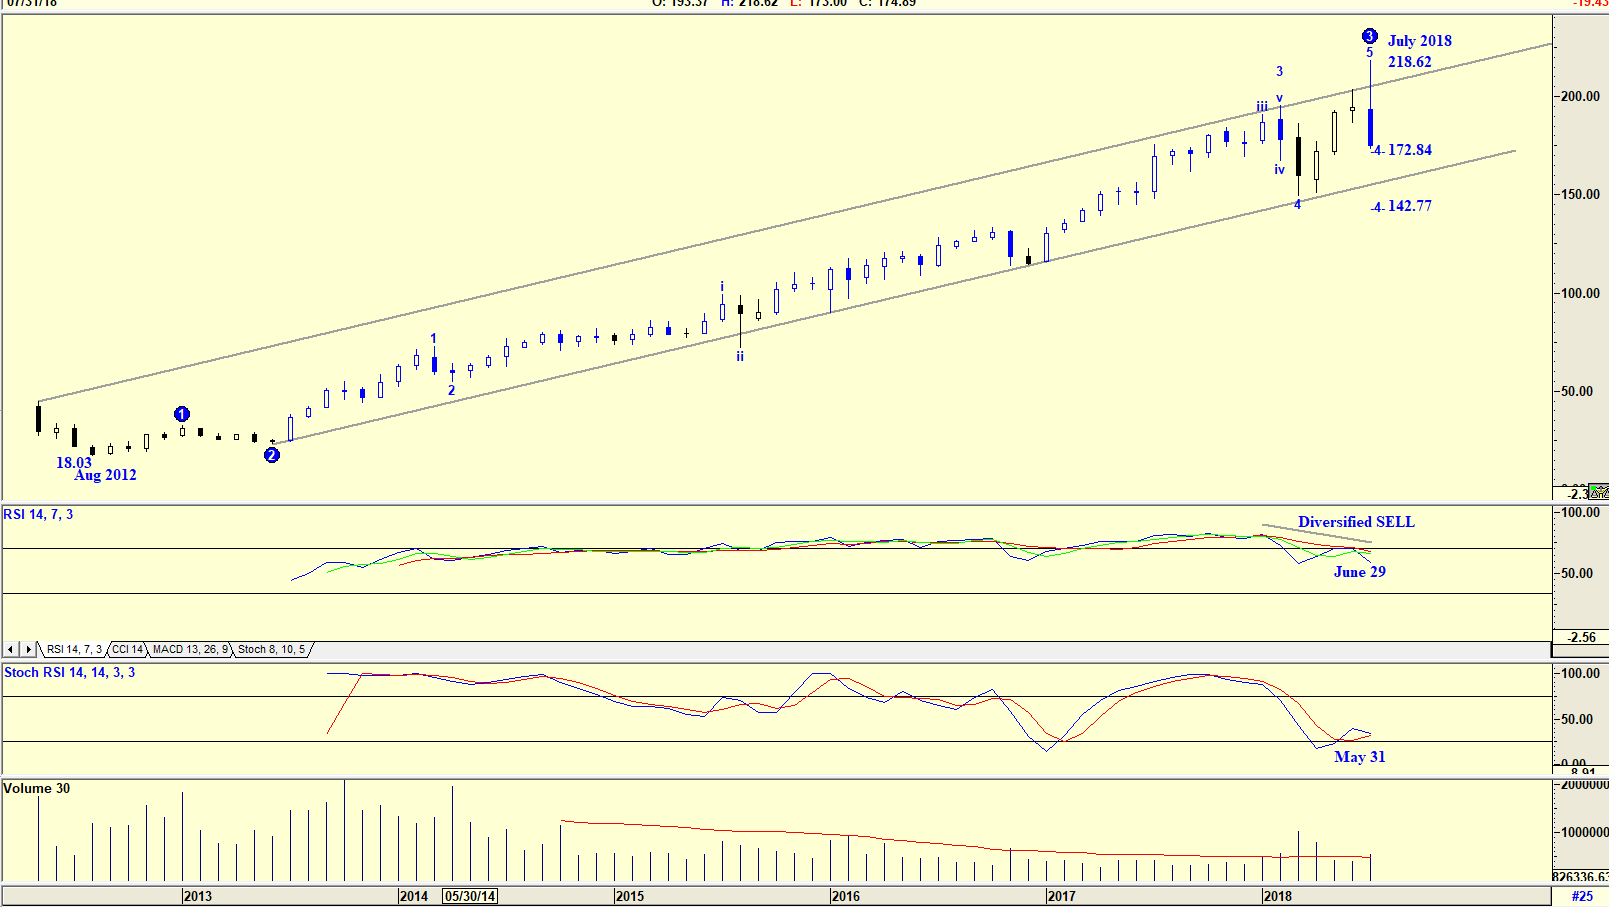
| Figure 1. Monthly Chart. |
| Graphic provided by: AdvancedGET. |
| |
| The chart in Figure 1 is a monthly chart showing how the share price rose strongly from a low of $18.03 in August 2012 to a high of 218.62 by July 2018. An Elliott wave count, as shown on the chart, suggests that the share price is in a WAVE 3 and should fall in a WAVE 4 to either $172.84 or $142.77. Analysts, therefore, expected a fall in the share price. The RSI Index did suggest a divergence sell on June 29, but the Stochastic RSI indicator gave a buy on May 31, suggesting strength for the future. |

|
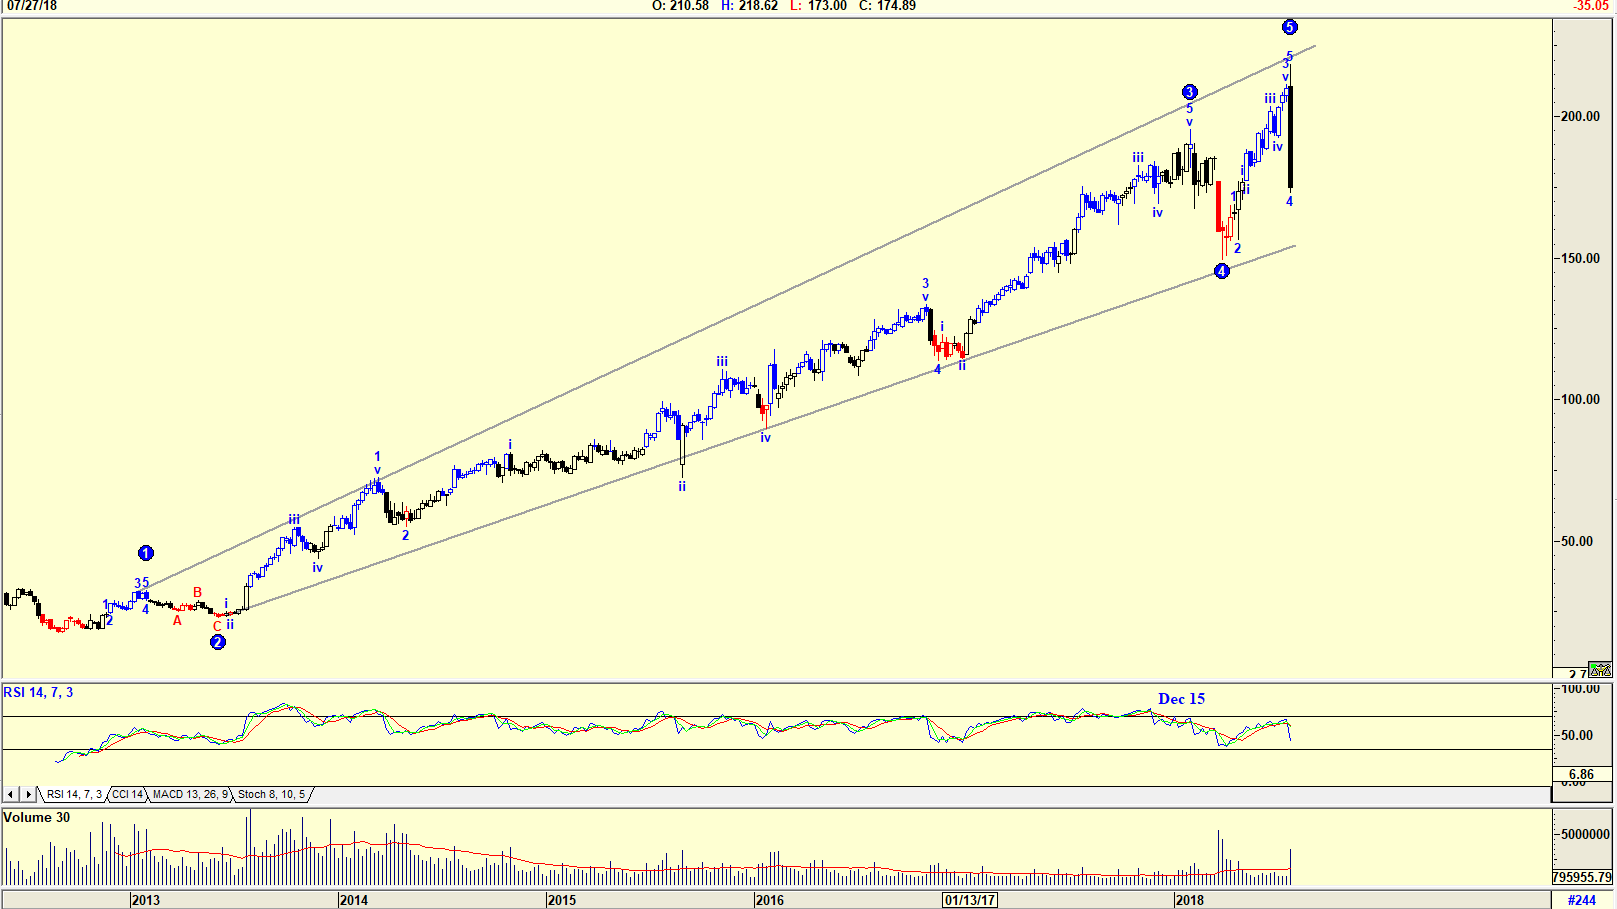
| Figure 2. Weekly Chart. |
| Graphic provided by: AdvancedGET. |
| |
| The chart in Figure 2 is a weekly chart with an Elliott wave count suggesting that the recent share price collapse was because the share had completed a WAVE 5. Do note the RSI indicator gave a sell signal on December 15, when the share price topped out in a WAVE 3. |

|
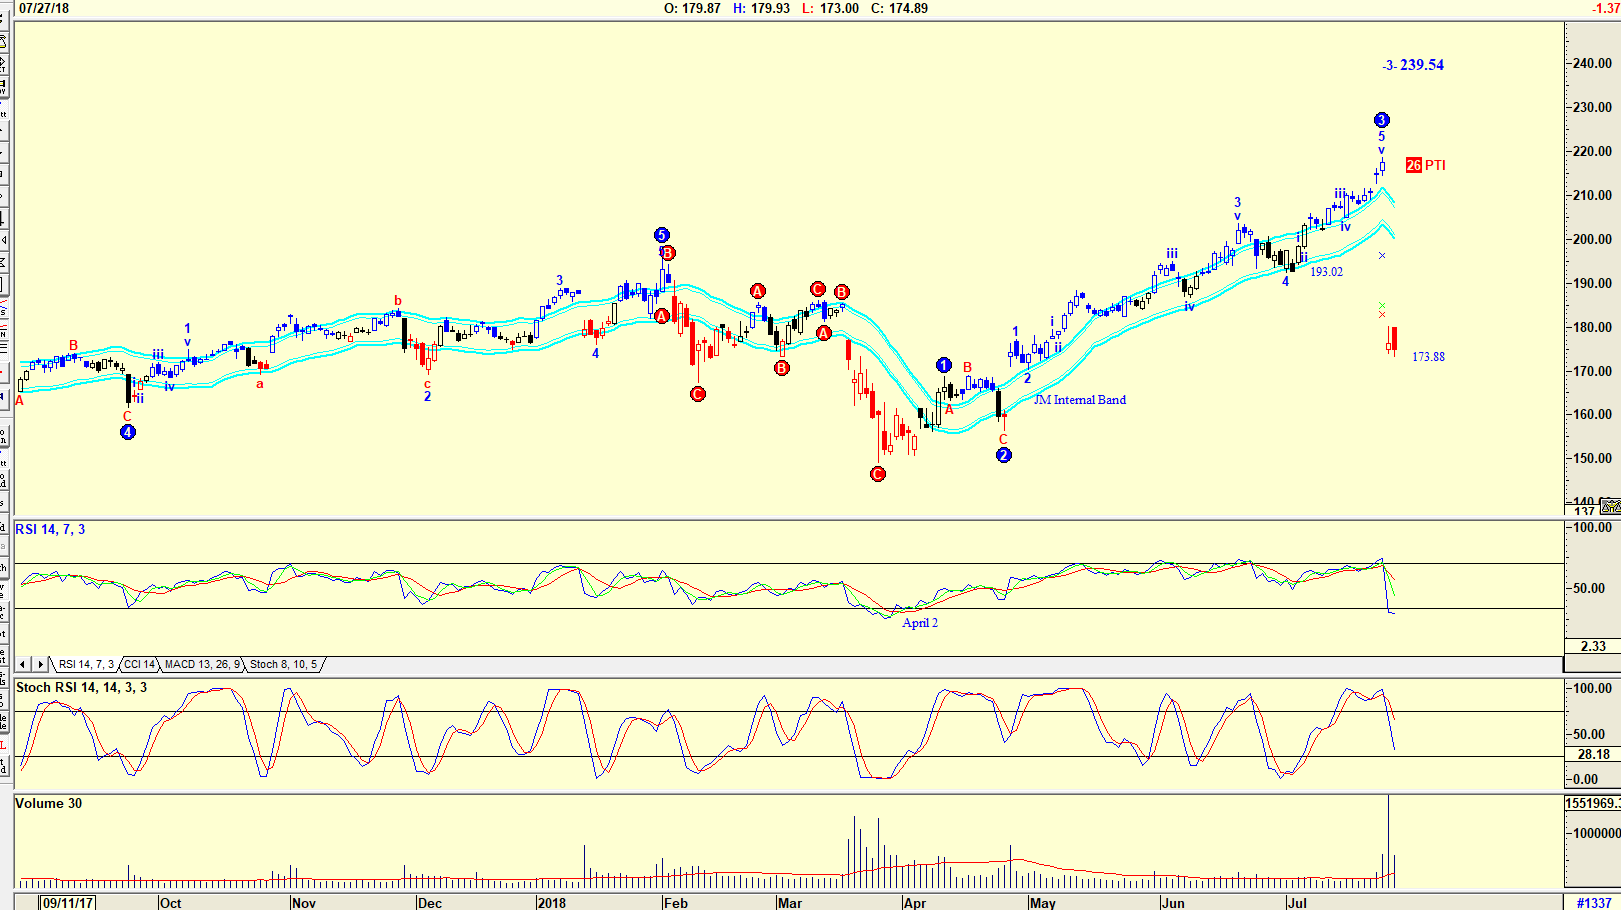
| Figure 3. Daily Chart. |
| Graphic provided by: AdvancedGET. |
| |
| The chart in Figure 3 is a daily chart with an Elliott wave count suggesting that the share price is in a WAVE 3. The count did suggest that the share could rise in a WAVE 3 to 239.54, but the PTI (Probability Index) of 26, is low, suggesting that this was unlikely to happen. The Wave 4 should not fall below the 4th Wave of lesser degree, the low being 193.02. The fact that the price did fall to 173.88, far below 193.02 is disturbing, suggesting that the Elliott count may revise itself sometime in the future. Do note the two indicators with the RSI at oversold levels and the Stochastic RSI approaching oversold levels. Neither indicator has give a buy signal. |

|
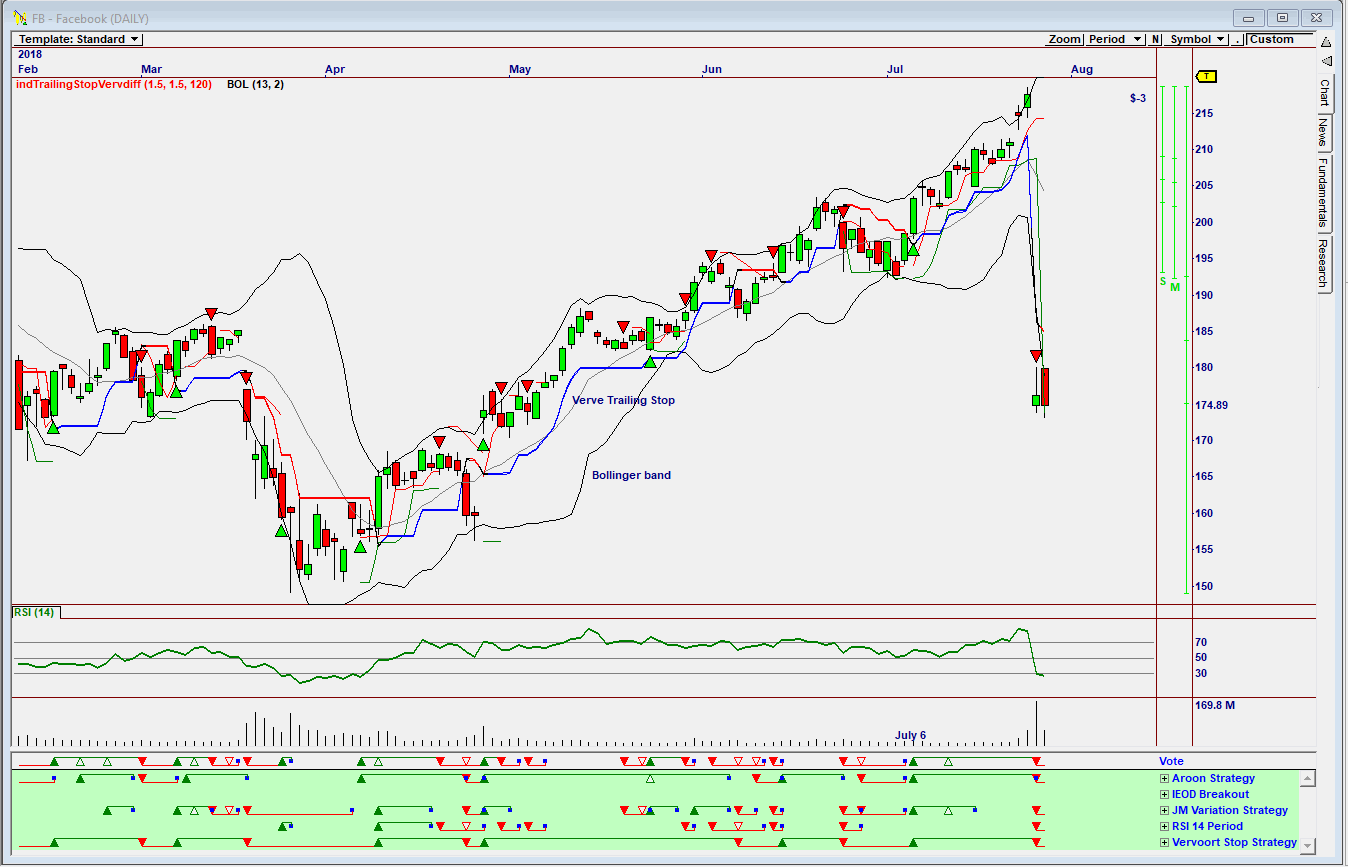
| Figure 4. Daily Omnitrader Chart. |
| Graphic provided by: Omnitrader. |
| |
| The chart in Figure 4 is an Omnitrader chart designed for day traders by myself. Do note the Vote line which suggested a buy on July 6, based on the Aroon Strategy, the JM Variation Strategy and the Vervoort Stop Strategy. None of the strategies shown suggested a sell signal before the share price crashed. Technical analysis on all my charts did not predict that the crash in the share price would occur when it did. Fundamentally, an investor may have sold shares as they rose because of the fundamental problems the company was having. The phrase, "When in doubt, get out," would have encouraged many investors to sell their shares. Buying the share at this low price could be an opportunity, but I would wait for a technical analysis buy signal before buying, even though technical analysis failed to forecast the crash in the price. |
Has been a technical analyst since 1969, and has worked as a futures and options trader with First Financial Futures in Johannesburg, South Africa.
| Address: | 3256 West 24th Ave |
| Vancouver, BC | |
| Phone # for sales: | 6042634214 |
| E-mail address: | petroosp@gmail.com |
Click here for more information about our publications!
PRINT THIS ARTICLE

Request Information From Our Sponsors
- VectorVest, Inc.
- Executive Premier Workshop
- One-Day Options Course
- OptionsPro
- Retirement Income Workshop
- Sure-Fire Trading Systems (VectorVest, Inc.)
- Trading as a Business Workshop
- VectorVest 7 EOD
- VectorVest 7 RealTime/IntraDay
- VectorVest AutoTester
- VectorVest Educational Services
- VectorVest OnLine
- VectorVest Options Analyzer
- VectorVest ProGraphics v6.0
- VectorVest ProTrader 7
- VectorVest RealTime Derby Tool
- VectorVest Simulator
- VectorVest Variator
- VectorVest Watchdog
- StockCharts.com, Inc.
- Candle Patterns
- Candlestick Charting Explained
- Intermarket Technical Analysis
- John Murphy on Chart Analysis
- John Murphy's Chart Pattern Recognition
- John Murphy's Market Message
- MurphyExplainsMarketAnalysis-Intermarket Analysis
- MurphyExplainsMarketAnalysis-Visual Analysis
- StockCharts.com
- Technical Analysis of the Financial Markets
- The Visual Investor
