HOT TOPICS LIST
- MACD
- Fibonacci
- RSI
- Gann
- ADXR
- Stochastics
- Volume
- Triangles
- Futures
- Cycles
- Volatility
- ZIGZAG
- MESA
- Retracement
- Aroon
INDICATORS LIST
LIST OF TOPICS
PRINT THIS ARTICLE
by Gary Grosschadl
The current hesitantcy in the markets is aptly represented by the Nasdaq's current battle with a multiyear trendline.
Position: N/A
Gary Grosschadl
Independent Canadian equities trader and technical analyst based in Peterborough
Ontario, Canada.
PRINT THIS ARTICLE
CHART ANALYSIS
Weekly Nasdaq Engaged In A Trendline Test
12/12/02 01:11:33 PMby Gary Grosschadl
The current hesitantcy in the markets is aptly represented by the Nasdaq's current battle with a multiyear trendline.
Position: N/A
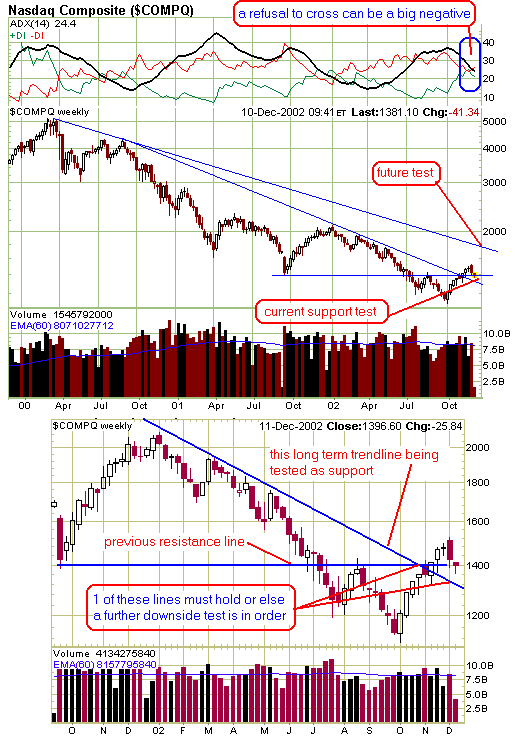
| Several weeks ago this index finally managed to surpass a 27-month trendline. Last week it was stopped abruptly with a bearish engulfing candlestick. It is not unusual for a support test shortly after an important line is breached, especially after such a strong multi-week run. Will this support zone hold as the Nasdaq takes a breather and tries to regain strength? |
| The directional movement indicator on this weekly chart is not giving a hopeful sign. It looked like it was headed for a bullish DI cross and then it refused to cross. This is often a very bearish sign when a cross is either a weak one that soon fails (as was done looking back at Nasdaq 2000) or a "refusal to cross" as this trend indicator is now showing. This shows bullish power has suddenly vanished and the bears once again begin to wrestle for control. Traders begin to feel that this run is overdone and smart money takes profits while others gladly resume short positions in the sectors that have run the hardest-- semi conductors for example. |

|
| Graphic provided by: StockCharts.com. |
| |
| At best we are headed for choppy action until this tug of war (no pun intended) between the bulls and bears is resolved - jerky sideways action tainted with uncertainty. At worst this may lead the market back down to re-test previous lows. If the truth lies in the middle, as the saying goes, then quite possibly this index goes down to successfully test support at 1200. Should the market decide to suddenly reverse again and resume a bullish run, then that upper trendline will most likely come into play. This level labelled "future test" is found at the slightly longer term trendline and lies around the 1900 level. Keep this level in mind when this index eventually finds the strength to resume the climb that has been suddenly halted. |
Independent Canadian equities trader and technical analyst based in Peterborough
Ontario, Canada.
| Website: | www.whatsonsale.ca/financial.html |
| E-mail address: | gwg7@sympatico.ca |
Click here for more information about our publications!
Comments
Date: 12/12/02Rank: 5Comment:
Date: 12/12/02Rank: 4Comment:
Date: 12/17/02Rank: 2Comment:
Date: 01/01/03Rank: 1Comment:

Request Information From Our Sponsors
- StockCharts.com, Inc.
- Candle Patterns
- Candlestick Charting Explained
- Intermarket Technical Analysis
- John Murphy on Chart Analysis
- John Murphy's Chart Pattern Recognition
- John Murphy's Market Message
- MurphyExplainsMarketAnalysis-Intermarket Analysis
- MurphyExplainsMarketAnalysis-Visual Analysis
- StockCharts.com
- Technical Analysis of the Financial Markets
- The Visual Investor
- VectorVest, Inc.
- Executive Premier Workshop
- One-Day Options Course
- OptionsPro
- Retirement Income Workshop
- Sure-Fire Trading Systems (VectorVest, Inc.)
- Trading as a Business Workshop
- VectorVest 7 EOD
- VectorVest 7 RealTime/IntraDay
- VectorVest AutoTester
- VectorVest Educational Services
- VectorVest OnLine
- VectorVest Options Analyzer
- VectorVest ProGraphics v6.0
- VectorVest ProTrader 7
- VectorVest RealTime Derby Tool
- VectorVest Simulator
- VectorVest Variator
- VectorVest Watchdog
