HOT TOPICS LIST
- MACD
- Fibonacci
- RSI
- Gann
- ADXR
- Stochastics
- Volume
- Triangles
- Futures
- Cycles
- Volatility
- ZIGZAG
- MESA
- Retracement
- Aroon
INDICATORS LIST
LIST OF TOPICS
PRINT THIS ARTICLE
by Koos van der Merwe
With the "Sell in May" mantra on everyone's mind as many traders go on holiday, is it worth trading the market at the moment?
Position: Buy
Koos van der Merwe
Has been a technical analyst since 1969, and has worked as a futures and options trader with First Financial Futures in Johannesburg, South Africa.
PRINT THIS ARTICLE
TECHNICAL ANALYSIS
Finding A Winner
08/16/18 04:28:56 PMby Koos van der Merwe
With the "Sell in May" mantra on everyone's mind as many traders go on holiday, is it worth trading the market at the moment?
Position: Buy
| Many market traders are enjoying the summer school holidays with their family. With the present market uncertainty created, taking a holiday and getting away from the news on the television is a break everyone needs. An American President that insults the Queen of England is not everyone's cup of tea. So, if you are still trading the market, how would you find a winner? |

|
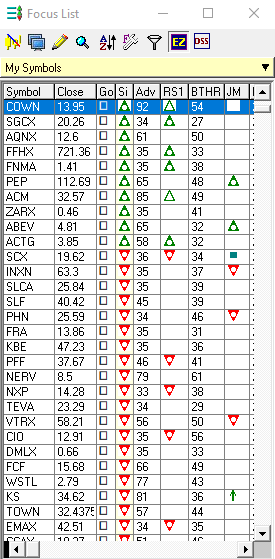
| Figure 1. Buy/Sell Signals On Omnitrader. |
| Graphic provided by: Omnitrader. |
| |
| Running the program Omnitrader across over 2000 shares after the close on Friday, July 13, only ten shares suggested a buy signal using the parameters employed as shown in Figure 1. Of these 10 shares, COWN, gave an ADV (Advisor Cut Off Rating) of 92 and a BTHR (Back Test Hit Rate) of 54 with an RSI buy. The next share ACM (Arcom Technology) gave an ADV of 85 and a BTHR of 49. We will look at COWN and analyze it further as a possible buy. |

|
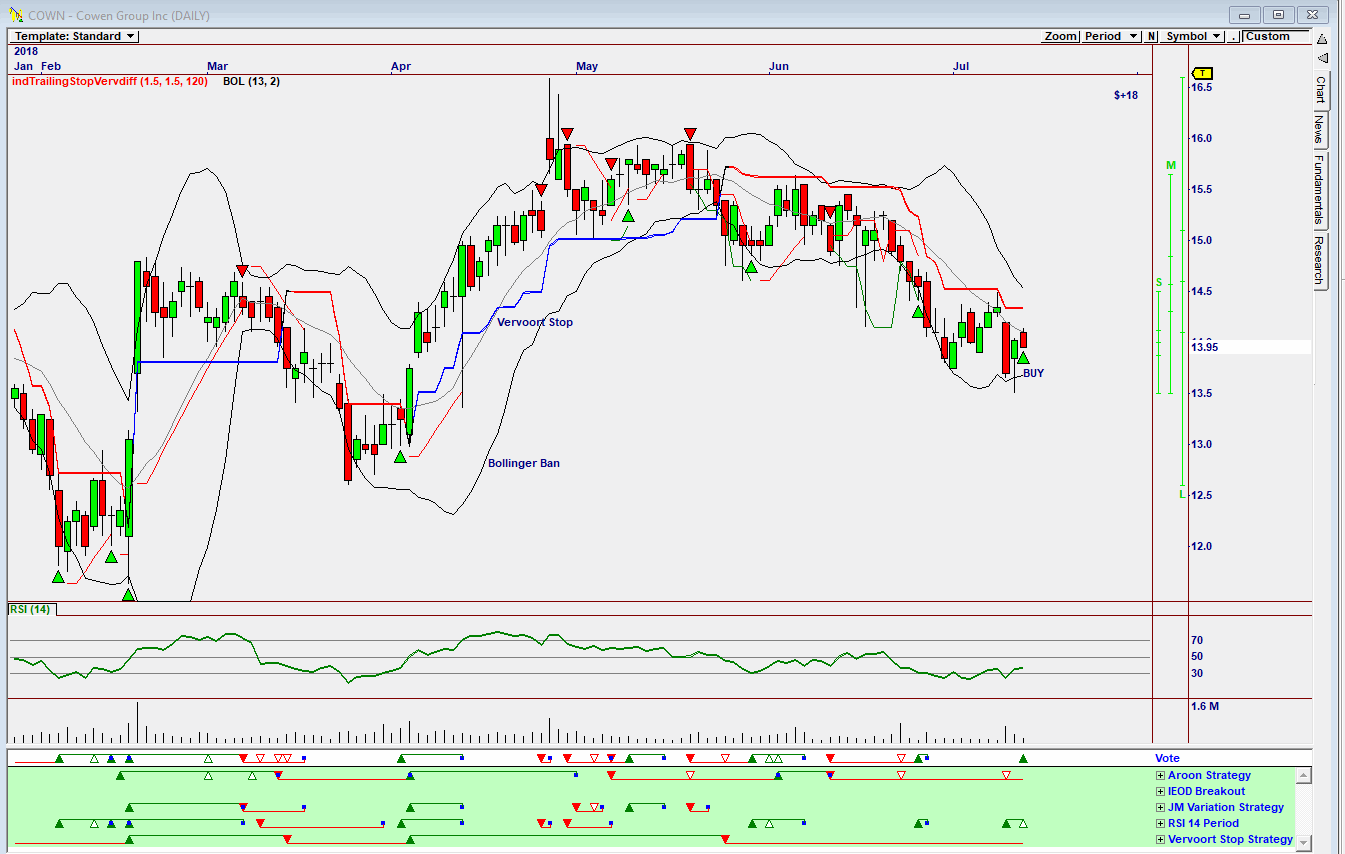
| Figre 2. Omnitrader chart showing a buy on the Vote line. |
| Graphic provided by: Omnitrader. |
| |
| The chart in Figure 2 is a daily chart of COWN showing a buy signal on the Vote line given by the RSI 14 period strategy. |

|
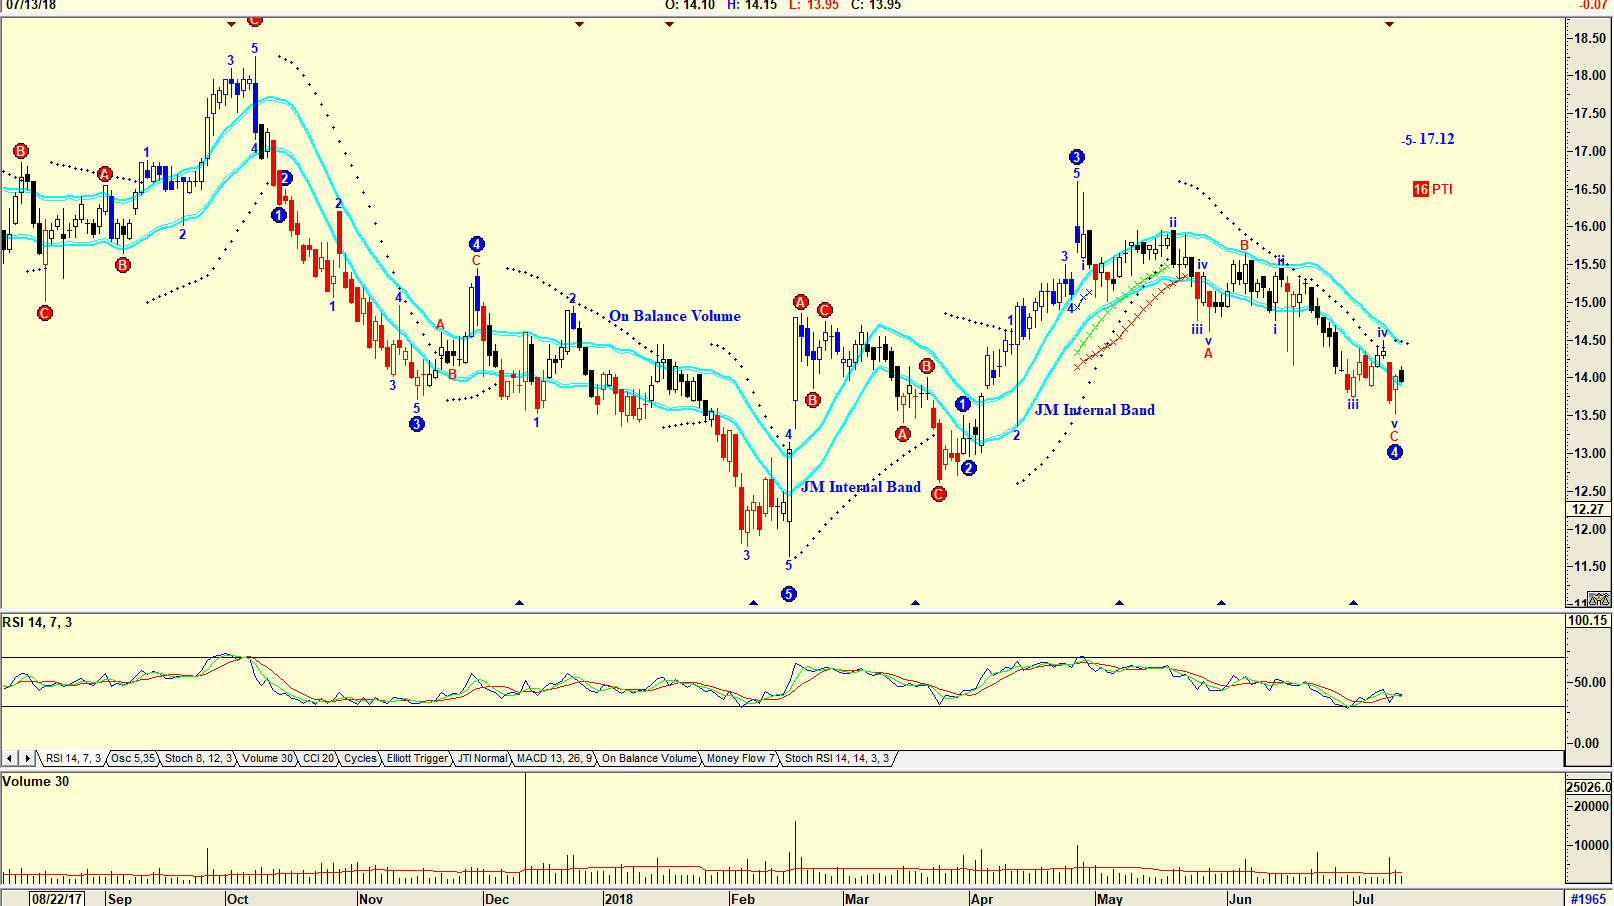
| Figure 3. An Advanced GET chart of the share. |
| Graphic provided by: AdvancedGET. |
| |
| Analyzing the share price further in Figure 3, with an Advanced GET daily chart, we see the following: The Elliott wave count is suggesting that the share price is in a WAVE 4. However, the PTI (Probability Index) of 16, suggesting that the share price could rise to $17.12, is very low. Volume on Friday's rise in the share price was also low, suggesting further weakness. The chart has also not suggested a JM Internal Band buy. A JM Internal Band is a simple 15-period moving average offset by 2% positive and 2% negative. A move above the upper band suggests a buy and below the lower band a sell. One can analyze charts further to find a winner. Looking at weekly or monthly charts would suggest long term winners, but whatever buy is suggested, it is worth analyzing well, because with the present political uncertainty, and trader frustration, anything can happen. |
Has been a technical analyst since 1969, and has worked as a futures and options trader with First Financial Futures in Johannesburg, South Africa.
| Address: | 3256 West 24th Ave |
| Vancouver, BC | |
| Phone # for sales: | 6042634214 |
| E-mail address: | petroosp@gmail.com |
Click here for more information about our publications!
PRINT THIS ARTICLE

Request Information From Our Sponsors
- VectorVest, Inc.
- Executive Premier Workshop
- One-Day Options Course
- OptionsPro
- Retirement Income Workshop
- Sure-Fire Trading Systems (VectorVest, Inc.)
- Trading as a Business Workshop
- VectorVest 7 EOD
- VectorVest 7 RealTime/IntraDay
- VectorVest AutoTester
- VectorVest Educational Services
- VectorVest OnLine
- VectorVest Options Analyzer
- VectorVest ProGraphics v6.0
- VectorVest ProTrader 7
- VectorVest RealTime Derby Tool
- VectorVest Simulator
- VectorVest Variator
- VectorVest Watchdog
- StockCharts.com, Inc.
- Candle Patterns
- Candlestick Charting Explained
- Intermarket Technical Analysis
- John Murphy on Chart Analysis
- John Murphy's Chart Pattern Recognition
- John Murphy's Market Message
- MurphyExplainsMarketAnalysis-Intermarket Analysis
- MurphyExplainsMarketAnalysis-Visual Analysis
- StockCharts.com
- Technical Analysis of the Financial Markets
- The Visual Investor
