HOT TOPICS LIST
- MACD
- Fibonacci
- RSI
- Gann
- ADXR
- Stochastics
- Volume
- Triangles
- Futures
- Cycles
- Volatility
- ZIGZAG
- MESA
- Retracement
- Aroon
INDICATORS LIST
LIST OF TOPICS
PRINT THIS ARTICLE
by Stella Osoba, CMT
Getting kicked out of the DOW is the most recent in a long line of ignominies for this iconic multinational conglomerate which has been in business since 1892. But bad news for a stock can be a contrarian indicator. Has GE bottomed at last or is there more pain ahead for this original member of the DOW and the only stock to have been continuously in the index since 1907?
Position: N/A
Stella Osoba, CMT
Stella Osoba is a trader and financial writer. She is a frequent contributor to "Technical Analysis of Stocks and Commodities" magazine and "Traders.com Advantage" as well as other financial publications.
PRINT THIS ARTICLE
TECHNICAL ANALYSIS
Kicked out of the DOW
07/12/18 04:00:44 PMby Stella Osoba, CMT
Getting kicked out of the DOW is the most recent in a long line of ignominies for this iconic multinational conglomerate which has been in business since 1892. But bad news for a stock can be a contrarian indicator. Has GE bottomed at last or is there more pain ahead for this original member of the DOW and the only stock to have been continuously in the index since 1907?
Position: N/A
| Today there are 30 members of the DOW, which is a price weighted index. When the index was first created by Charles Dow in 1896, the first DOW index of purely industrial stocks had 12 components. GE was added to the index but removed and restored several times until November 7, 1907. After its last restoration in November 7, 1907, GE has remained continuously in the DOW until it was recently removed in June of 2018. |

|
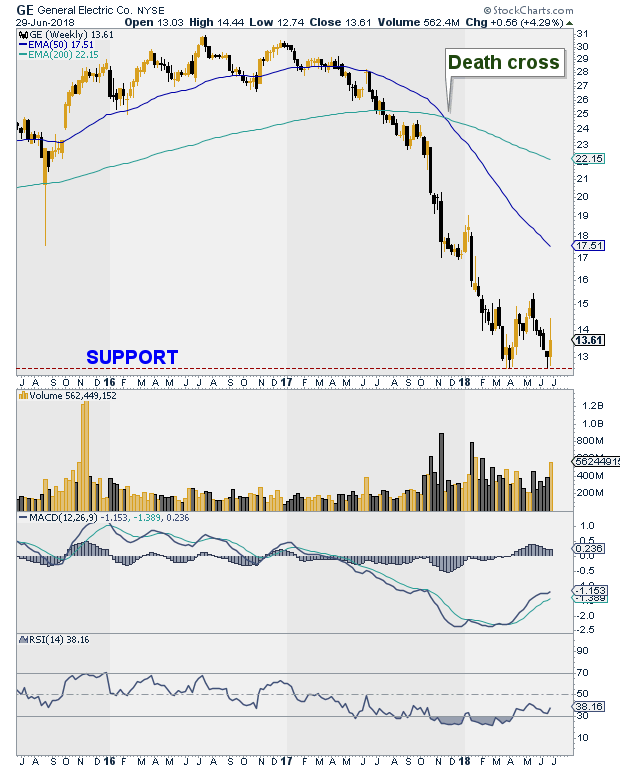
| Figure 1: Weekly chart for GE. |
| Graphic provided by: StockCharts.com. |
| |
| A look at the weekly chart of GE shows a long and painful descent of the stock price beginning in July 2016 when it topped out at around $30 per share. Price has fallen to below $13 a share and remains close to its recent lows. |
| GE is trading below both its 50-day and 200-day moving averages. It formed a death cross in November 2017 that signaled the continuation of its long, unrelenting decline. But the weekly chart of GE shows that the stock is attempting to find support at around $12.61. In March 2018, it previously found support at this level. The next test of this level was completed on June 18, 2018, where the weekly candlestick formed a hammer — a bullish signal. |
| GE has recently risen from oversold levels as indicated by the RSI. It is also showing positive divergence with the MACD. Volume in the last week of trading in June 2018 has been strong showing buying pressure coming in. But time will tell whether these recently formed support levels will hold. |
| Look to see if GE can continue making positive weekly closes. If it can close above $15.50 before its next reaction, the stock's trend reversal may have some staying power. With any stock that has seen a lengthy downtrend, it is always best not to anticipate the reversal. Getting into a trade too early can be just as bad as getting the trend wrong. Stock prices will always take the path of least resistance and in GE's case, it is too soon to tell that this is not down. The recent pause that we are seeing in price might just be GE staking out a sideways trend in a larger continuation pattern. But it will be interesting to watch this stock carefully, because bad news might, after all, be bullish for this stock. |
Stella Osoba is a trader and financial writer. She is a frequent contributor to "Technical Analysis of Stocks and Commodities" magazine and "Traders.com Advantage" as well as other financial publications.
| E-mail address: | stellaosoba@gmail.com |
Click here for more information about our publications!
PRINT THIS ARTICLE

Request Information From Our Sponsors
- StockCharts.com, Inc.
- Candle Patterns
- Candlestick Charting Explained
- Intermarket Technical Analysis
- John Murphy on Chart Analysis
- John Murphy's Chart Pattern Recognition
- John Murphy's Market Message
- MurphyExplainsMarketAnalysis-Intermarket Analysis
- MurphyExplainsMarketAnalysis-Visual Analysis
- StockCharts.com
- Technical Analysis of the Financial Markets
- The Visual Investor
- VectorVest, Inc.
- Executive Premier Workshop
- One-Day Options Course
- OptionsPro
- Retirement Income Workshop
- Sure-Fire Trading Systems (VectorVest, Inc.)
- Trading as a Business Workshop
- VectorVest 7 EOD
- VectorVest 7 RealTime/IntraDay
- VectorVest AutoTester
- VectorVest Educational Services
- VectorVest OnLine
- VectorVest Options Analyzer
- VectorVest ProGraphics v6.0
- VectorVest ProTrader 7
- VectorVest RealTime Derby Tool
- VectorVest Simulator
- VectorVest Variator
- VectorVest Watchdog
