HOT TOPICS LIST
- MACD
- Fibonacci
- RSI
- Gann
- ADXR
- Stochastics
- Volume
- Triangles
- Futures
- Cycles
- Volatility
- ZIGZAG
- MESA
- Retracement
- Aroon
INDICATORS LIST
LIST OF TOPICS
PRINT THIS ARTICLE
by Koos van der Merwe
There are many indicators out there and finding one that suits you can be not that easy.
Position: Accumulate
Koos van der Merwe
Has been a technical analyst since 1969, and has worked as a futures and options trader with First Financial Futures in Johannesburg, South Africa.
PRINT THIS ARTICLE
STOCHASTICS
Trading With Stochastic RSI
07/26/18 03:49:13 PMby Koos van der Merwe
There are many indicators out there and finding one that suits you can be not that easy.
Position: Accumulate
| J. Welles Wilder is best known for his work in technical analysis of the stock markets. He founded several technical indicators that are today considered to be the core in technical analysis software. These include Average True Range, the Relative Strength Index (RSI), the Average Directional Index and the Parabolic SAR. One of his most famous quotes is "Letting your emotions override your plan or system is the biggest cause of failure." In the 1950's, Dr. George Lane developed the Stochastic Oscillator, a momentum indicator that uses support and resistance levels to predict price turning points by comparing the closing price of a security to its price range. Then came the Stochastic RSI indicator, essentially an indicator of an indicator. The indicator is primarily used to identify overbought and oversold conditions, however, today with a simple moving average on it, day traders are using the indicator more and more to suggest buy/sell levels. |

|
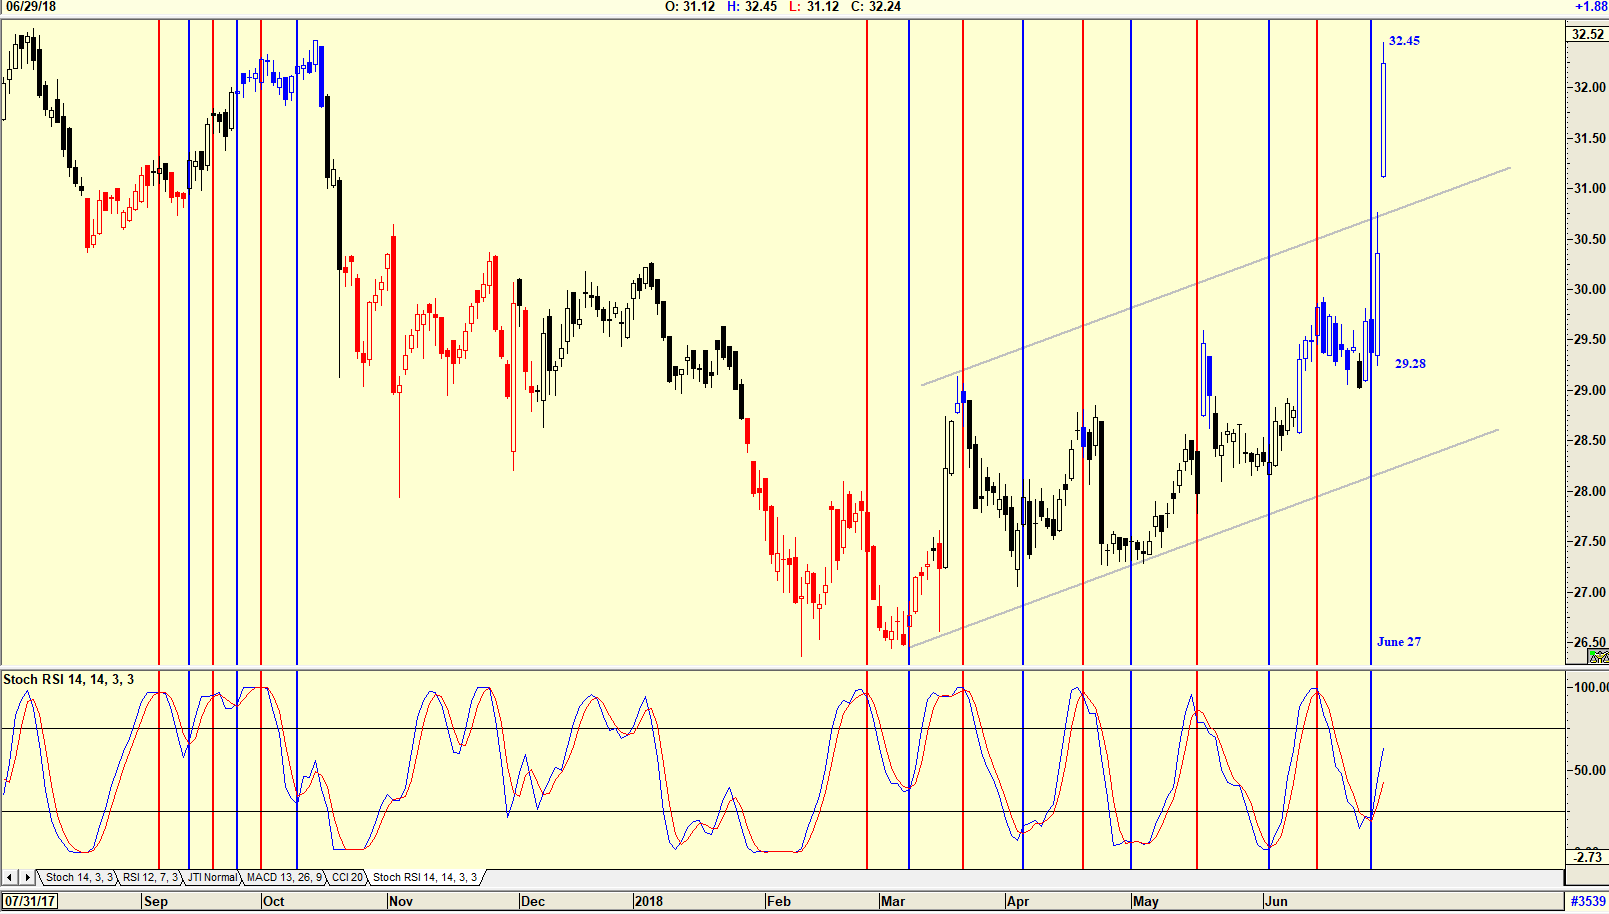
| Figure 1. Enbridge Income Fund. |
| Graphic provided by: AdvancedGET. |
| |
| The chart in Figure 1 is a chart of Enbridge Income Fund Holdings, listed on the Toronto Stock Exchange. The chart is a daily chart with a Stochastic RSI (14, 14, 3, 3). The indicator also shows two horizontal lines, one at 20 and one at 80 periods. The general consensus is to trade the indicator when it breaks above and below the two horizontal lines, however day traders are finding that a move above or below the moving average on the indicator suggests a better signal. Looking at the chart where I have shown only a few movements one can see that on June 27 the Stochastic RSI, by moving above the moving average line, suggested a buy. What is more interesting is that the buy signal was suggested the day before a major announcement was made that Enbridge's Line 3 Replacement Project was approved by Minnesota Public Utilities Commission. The chart shows how the share price rose strongly from $29.28 to $32.48 on June 29. Daytraders scored well. What I find interesting is that the indicator suggested a buy on June 27, two days before the announcement. |

|
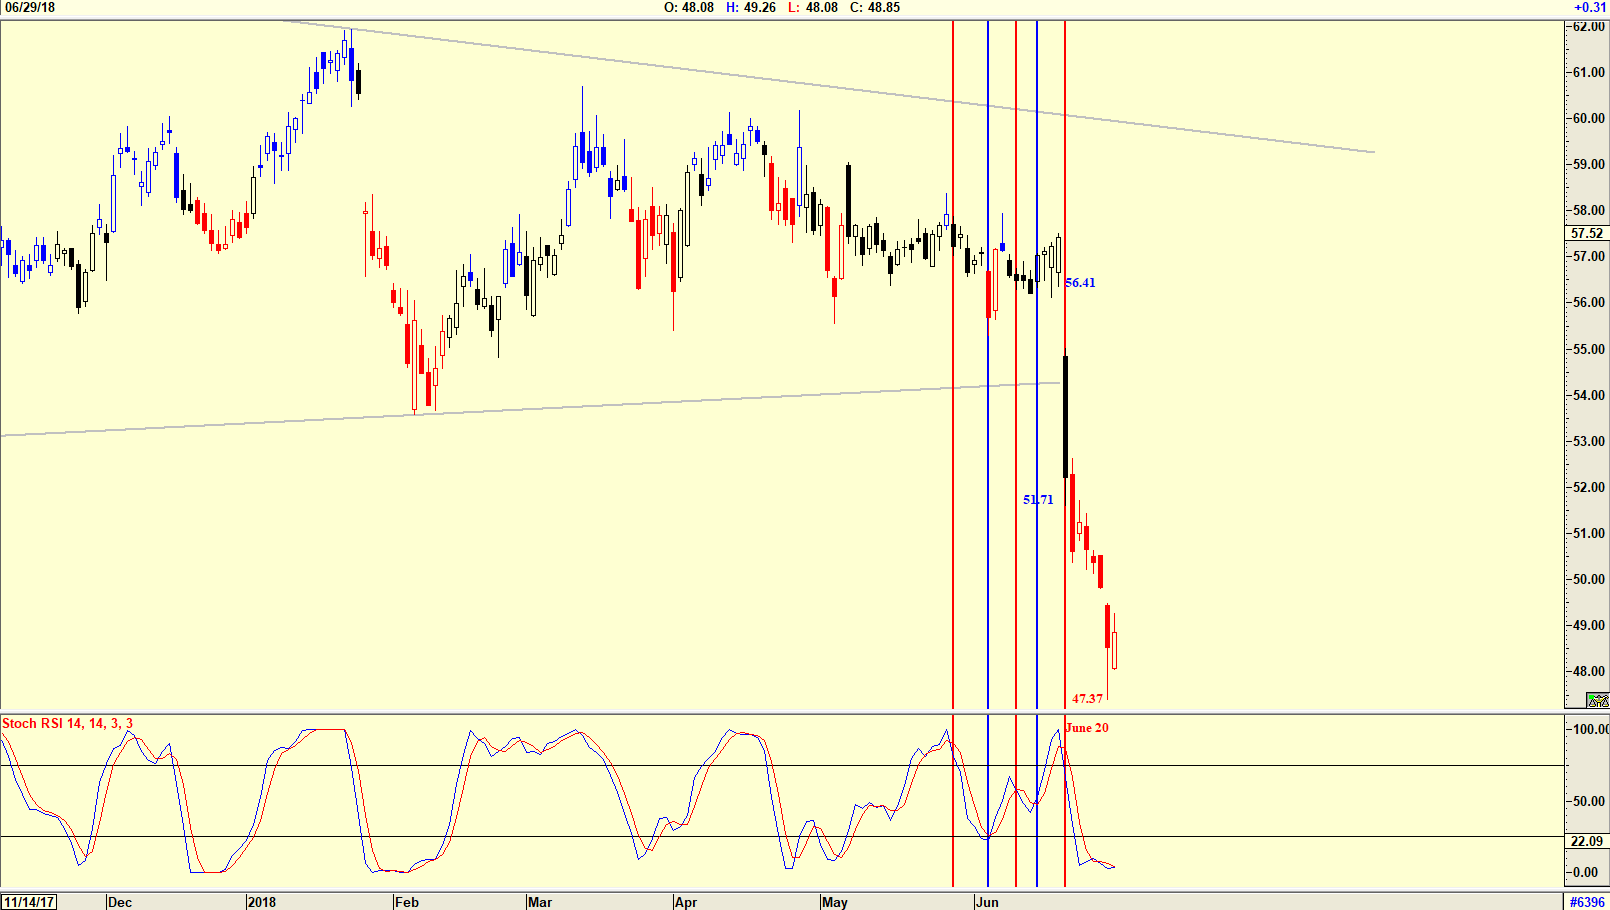
| Figure 2. Starbucks. |
| Graphic provided by: AdvancedGET. |
| |
| Looking at Starbucks in Figure 2 one can see how a sell signal was suggested on June 20 — and the price dropped strongly. Then on June 22, Howard Schultz announced that "Starbucks is undervalued and underpriced." The Stochastic RSI indicator gave a sell on June 20 after the share price dropped from $56.41 to $51.71. The indicator has not yet suggested a buy, but it is very close to it. With the up correction on June 29 and with the price closing at $48.85, one could read that the indicator has suggested a buy. With day trading becoming more and more active, adjusting an existing indicator and reading it for a buy/sell signal is becoming more and more common. |
Has been a technical analyst since 1969, and has worked as a futures and options trader with First Financial Futures in Johannesburg, South Africa.
| Address: | 3256 West 24th Ave |
| Vancouver, BC | |
| Phone # for sales: | 6042634214 |
| E-mail address: | petroosp@gmail.com |
Click here for more information about our publications!
Comments
Date: 07/28/18Rank: 4Comment:
Date: 12/07/22Rank: 3Comment:
Date: 04/21/23Rank: 4Comment:

Request Information From Our Sponsors
- StockCharts.com, Inc.
- Candle Patterns
- Candlestick Charting Explained
- Intermarket Technical Analysis
- John Murphy on Chart Analysis
- John Murphy's Chart Pattern Recognition
- John Murphy's Market Message
- MurphyExplainsMarketAnalysis-Intermarket Analysis
- MurphyExplainsMarketAnalysis-Visual Analysis
- StockCharts.com
- Technical Analysis of the Financial Markets
- The Visual Investor
- VectorVest, Inc.
- Executive Premier Workshop
- One-Day Options Course
- OptionsPro
- Retirement Income Workshop
- Sure-Fire Trading Systems (VectorVest, Inc.)
- Trading as a Business Workshop
- VectorVest 7 EOD
- VectorVest 7 RealTime/IntraDay
- VectorVest AutoTester
- VectorVest Educational Services
- VectorVest OnLine
- VectorVest Options Analyzer
- VectorVest ProGraphics v6.0
- VectorVest ProTrader 7
- VectorVest RealTime Derby Tool
- VectorVest Simulator
- VectorVest Variator
- VectorVest Watchdog
